Herbalife Ltd.'s management explains the business in its own materials. The slides below do the most of that work, pulled from the documents preserved in Sources. Each source link opens the complete presentation at that slide in a new tab.
Management's own zero-to-one explainer: business model, distribution channel, market position, brand portfolio and five-year financials. · Open the full document →
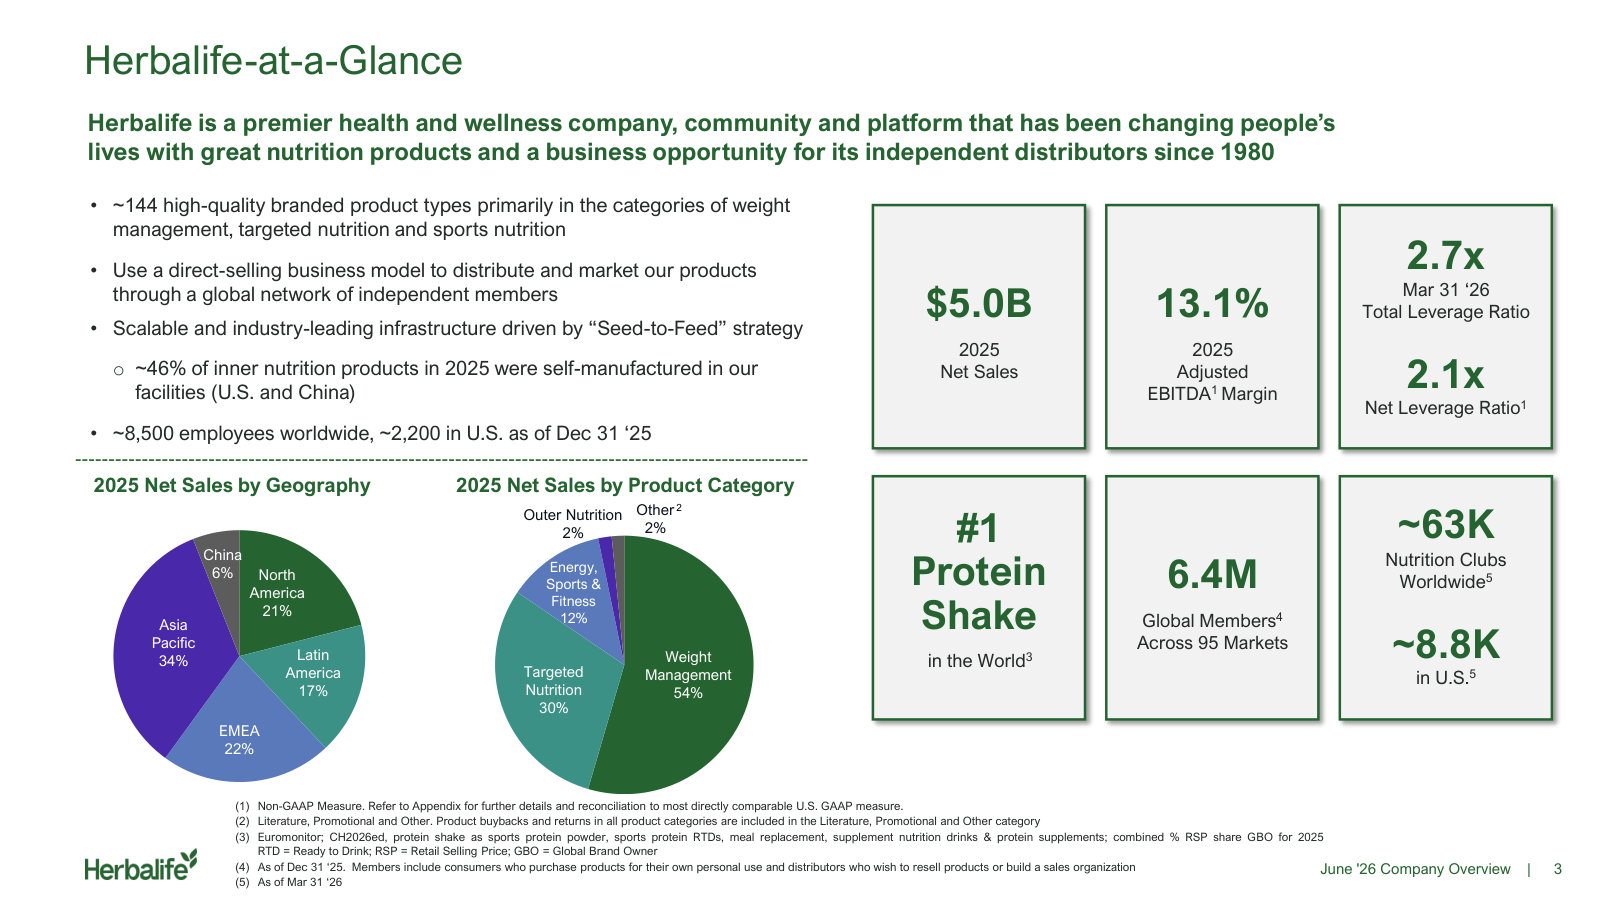
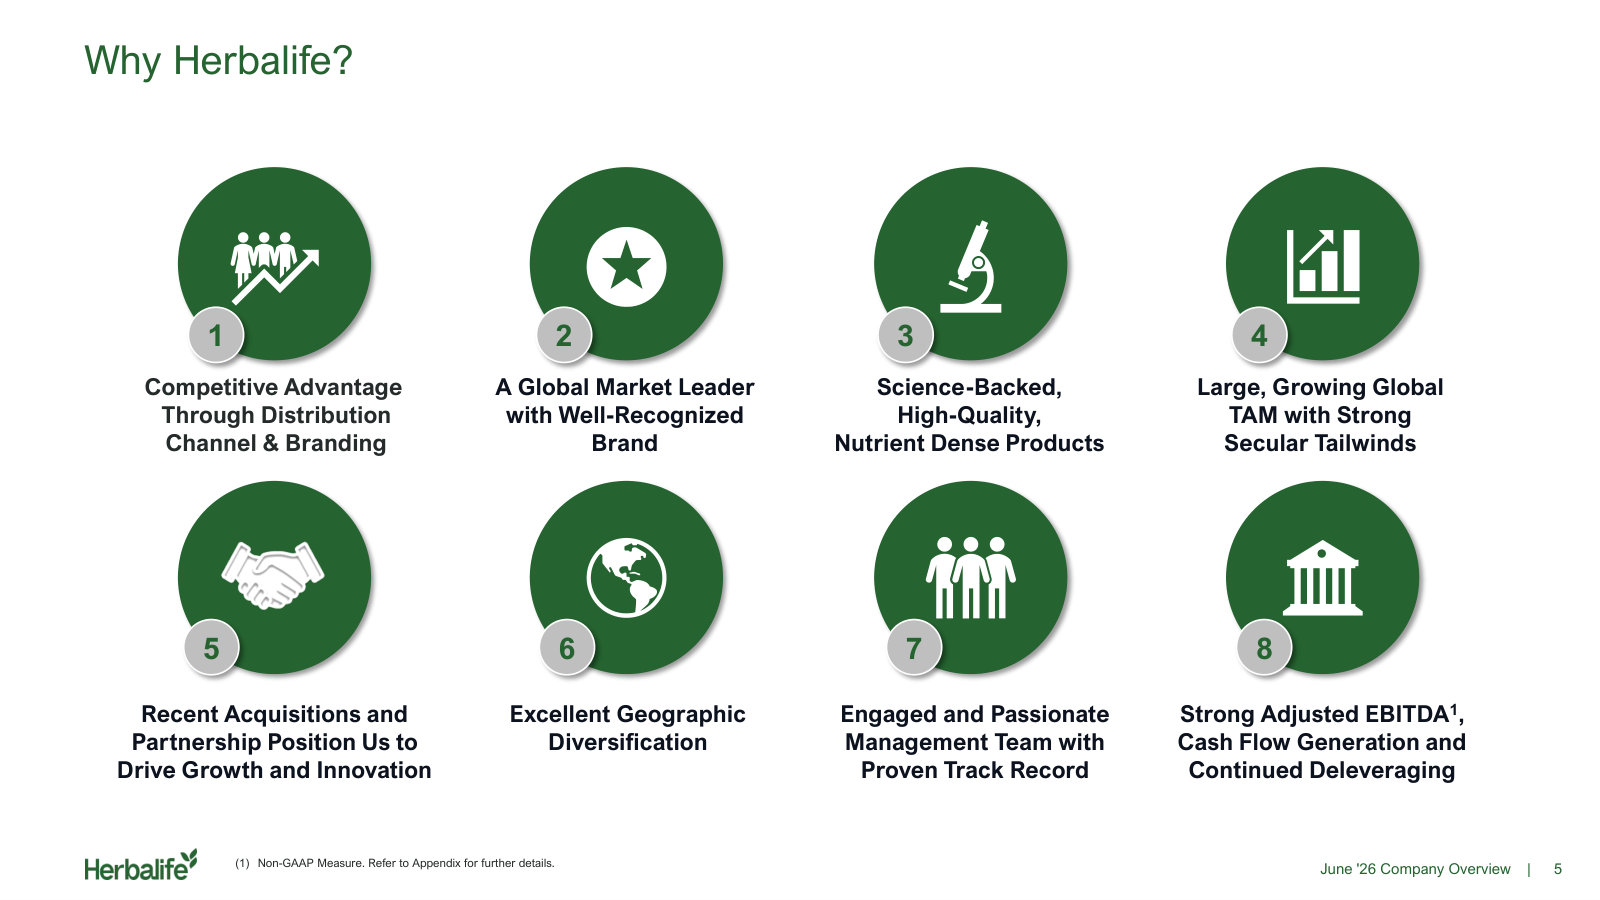
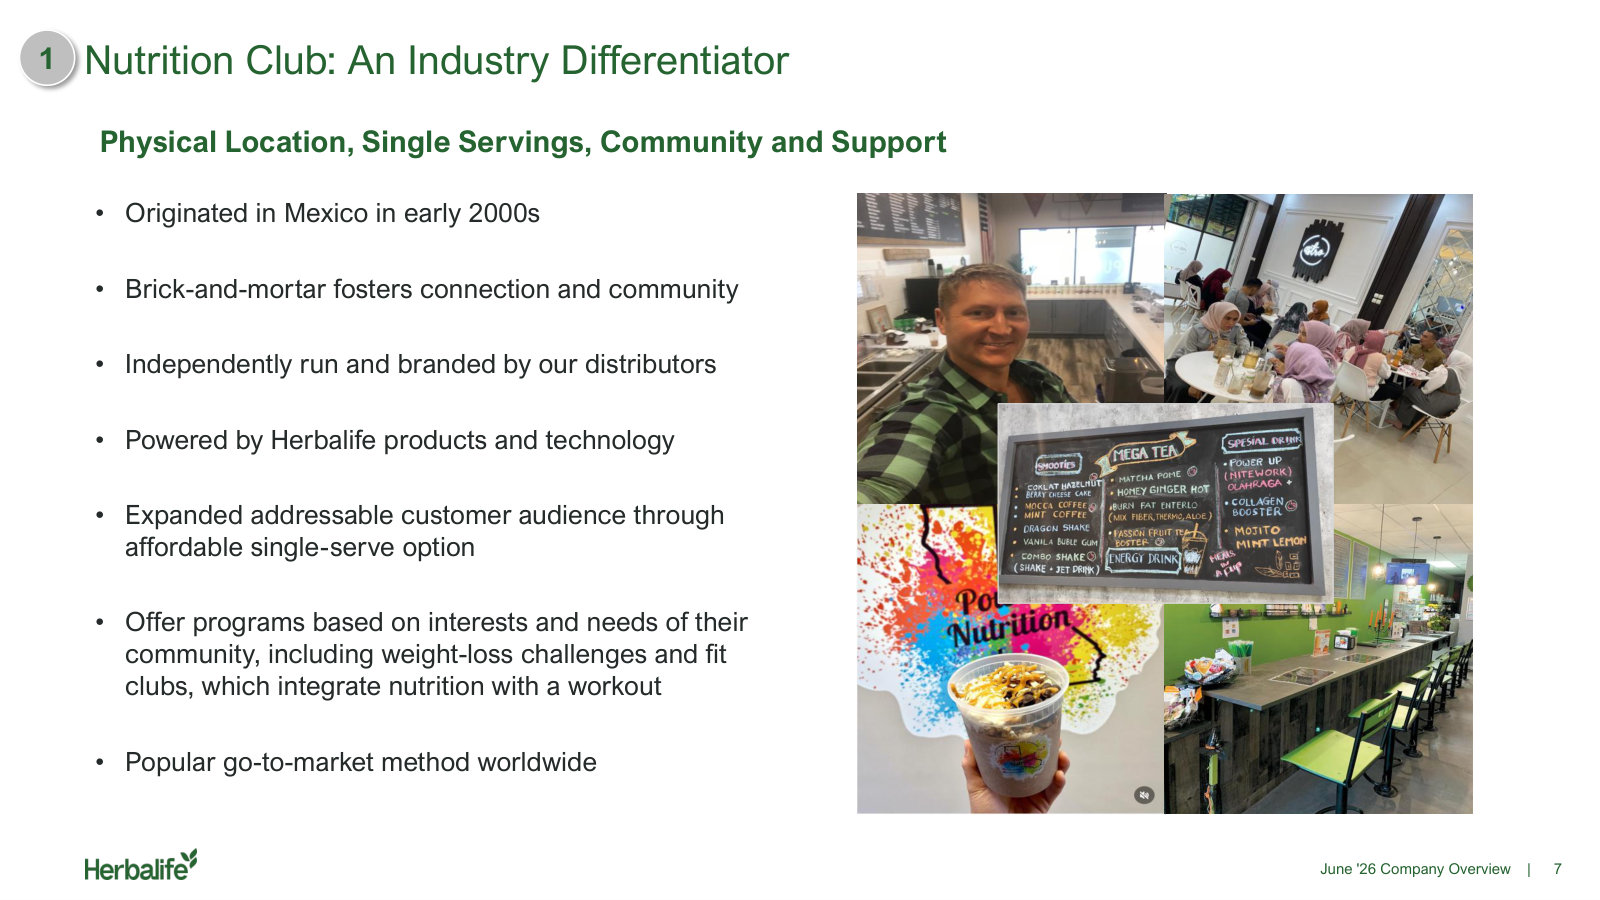
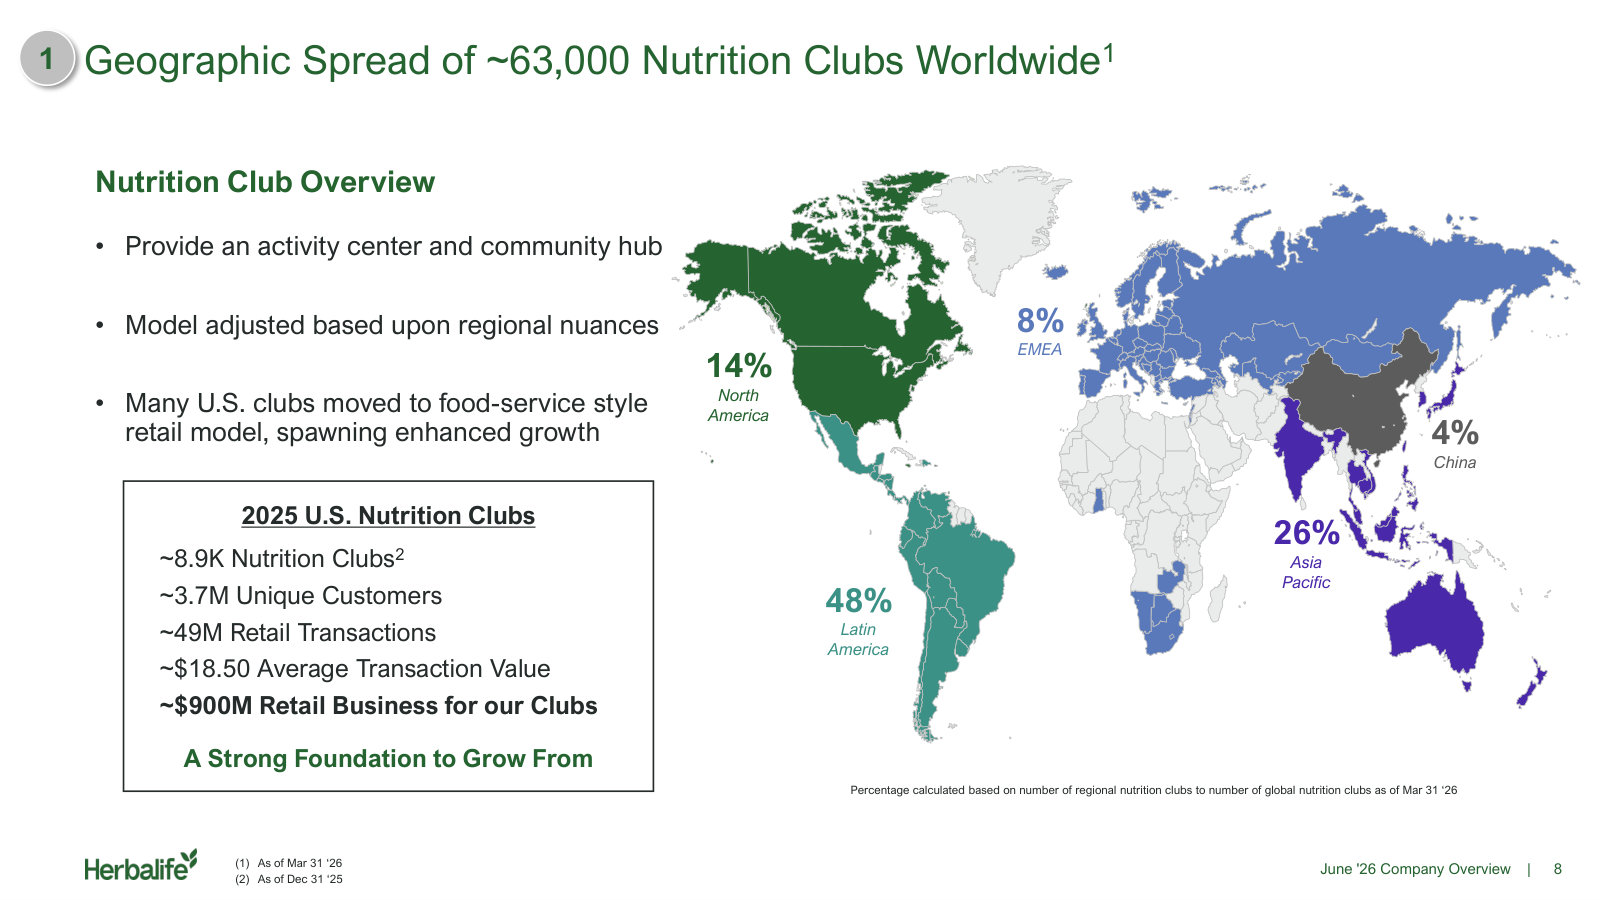
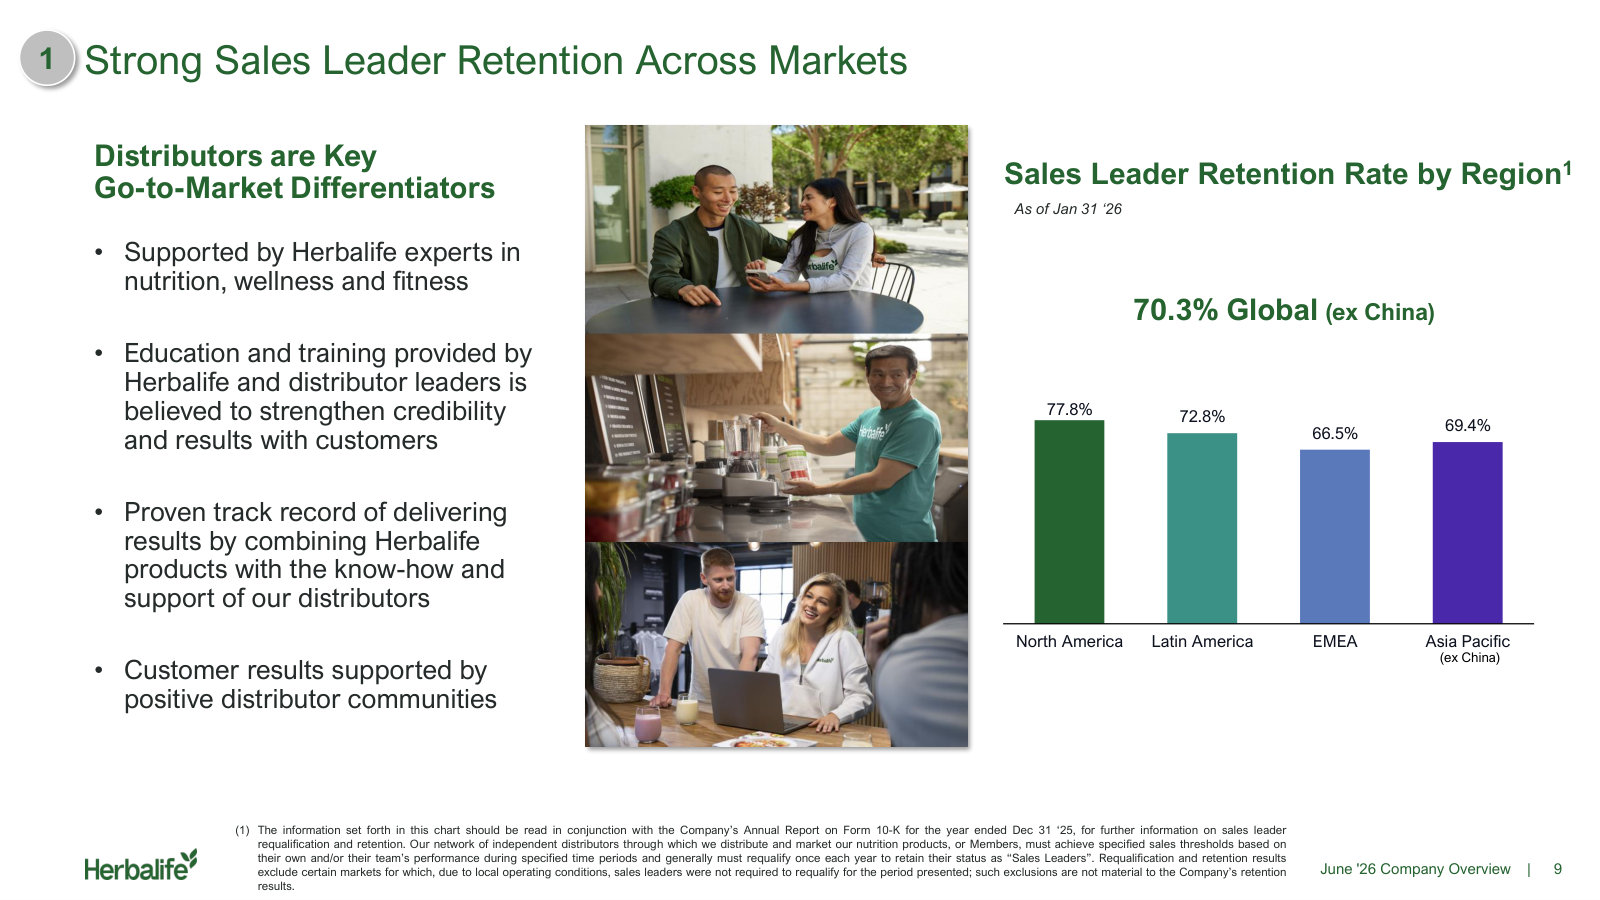
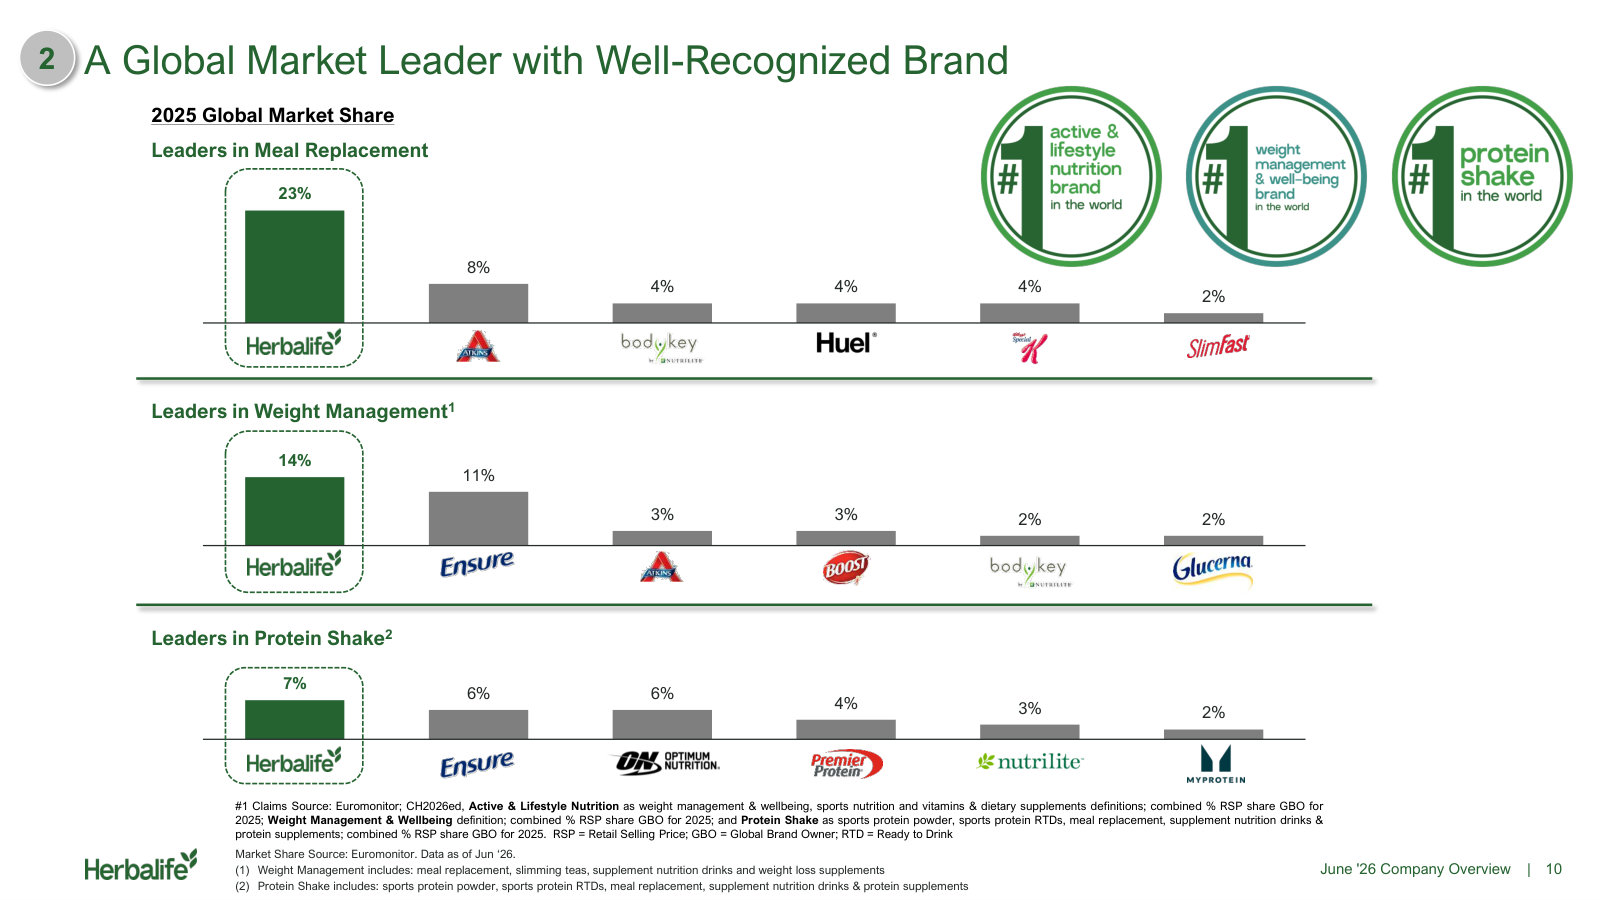
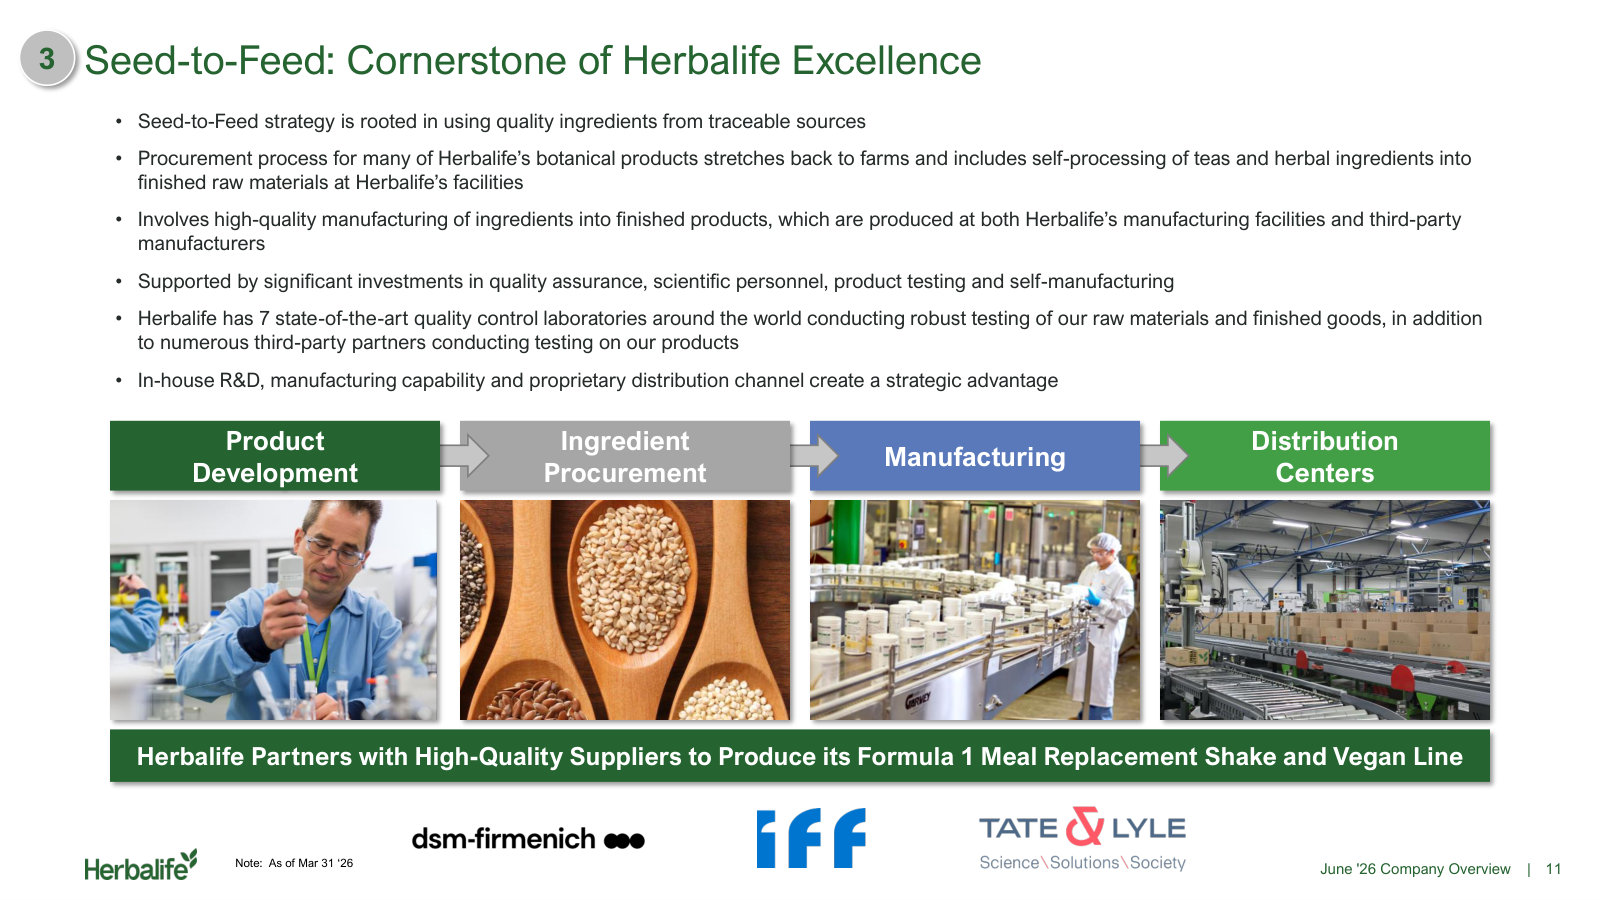
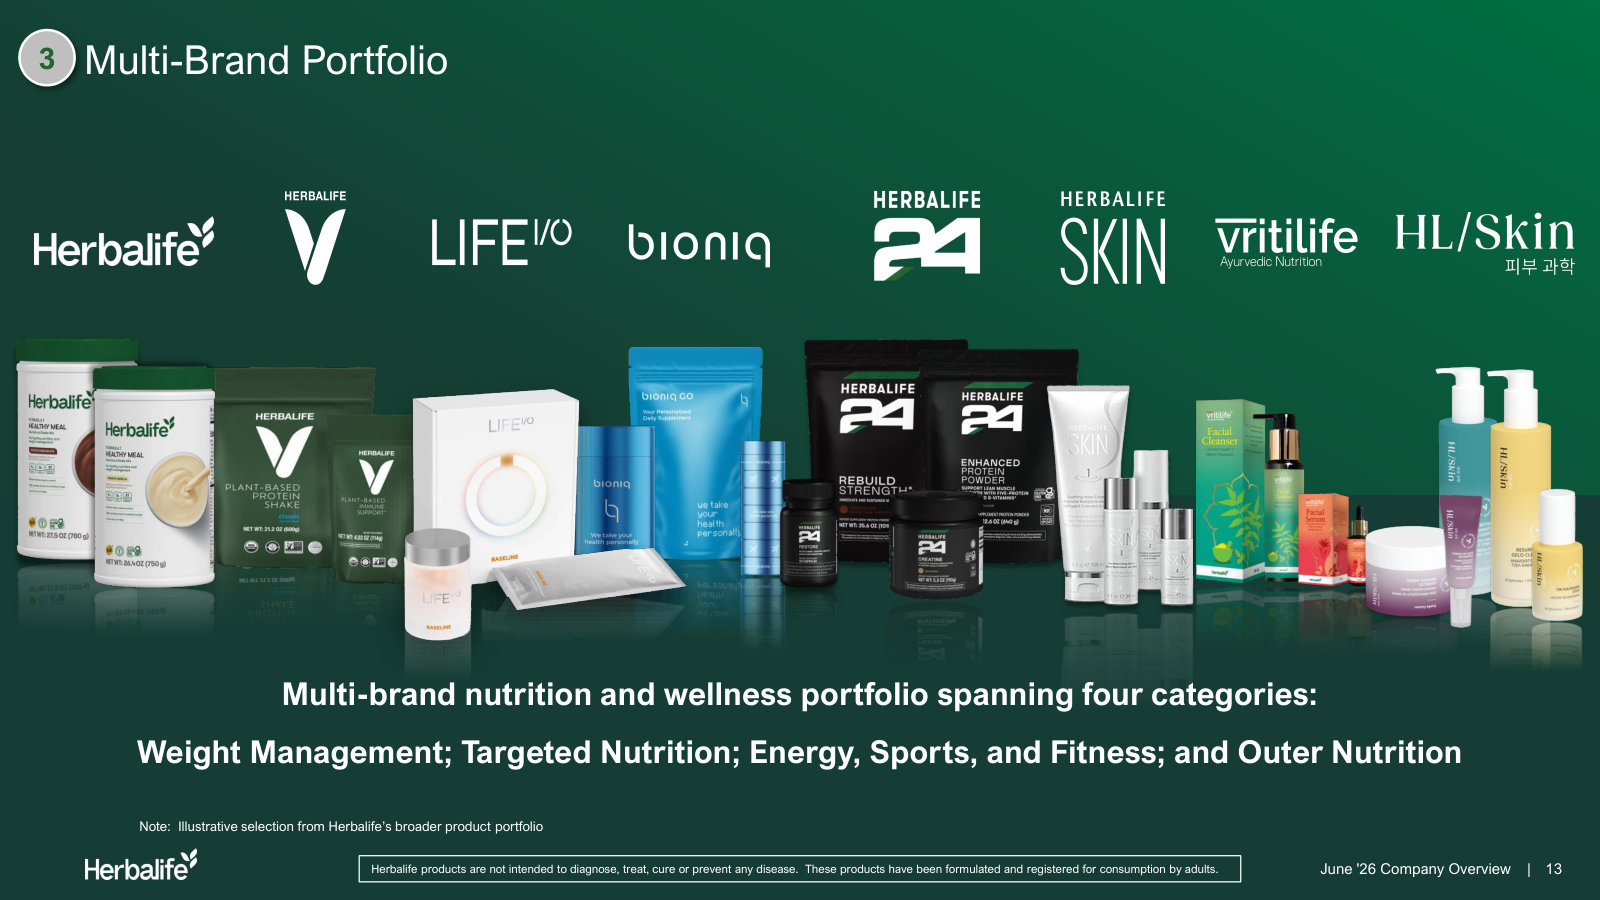
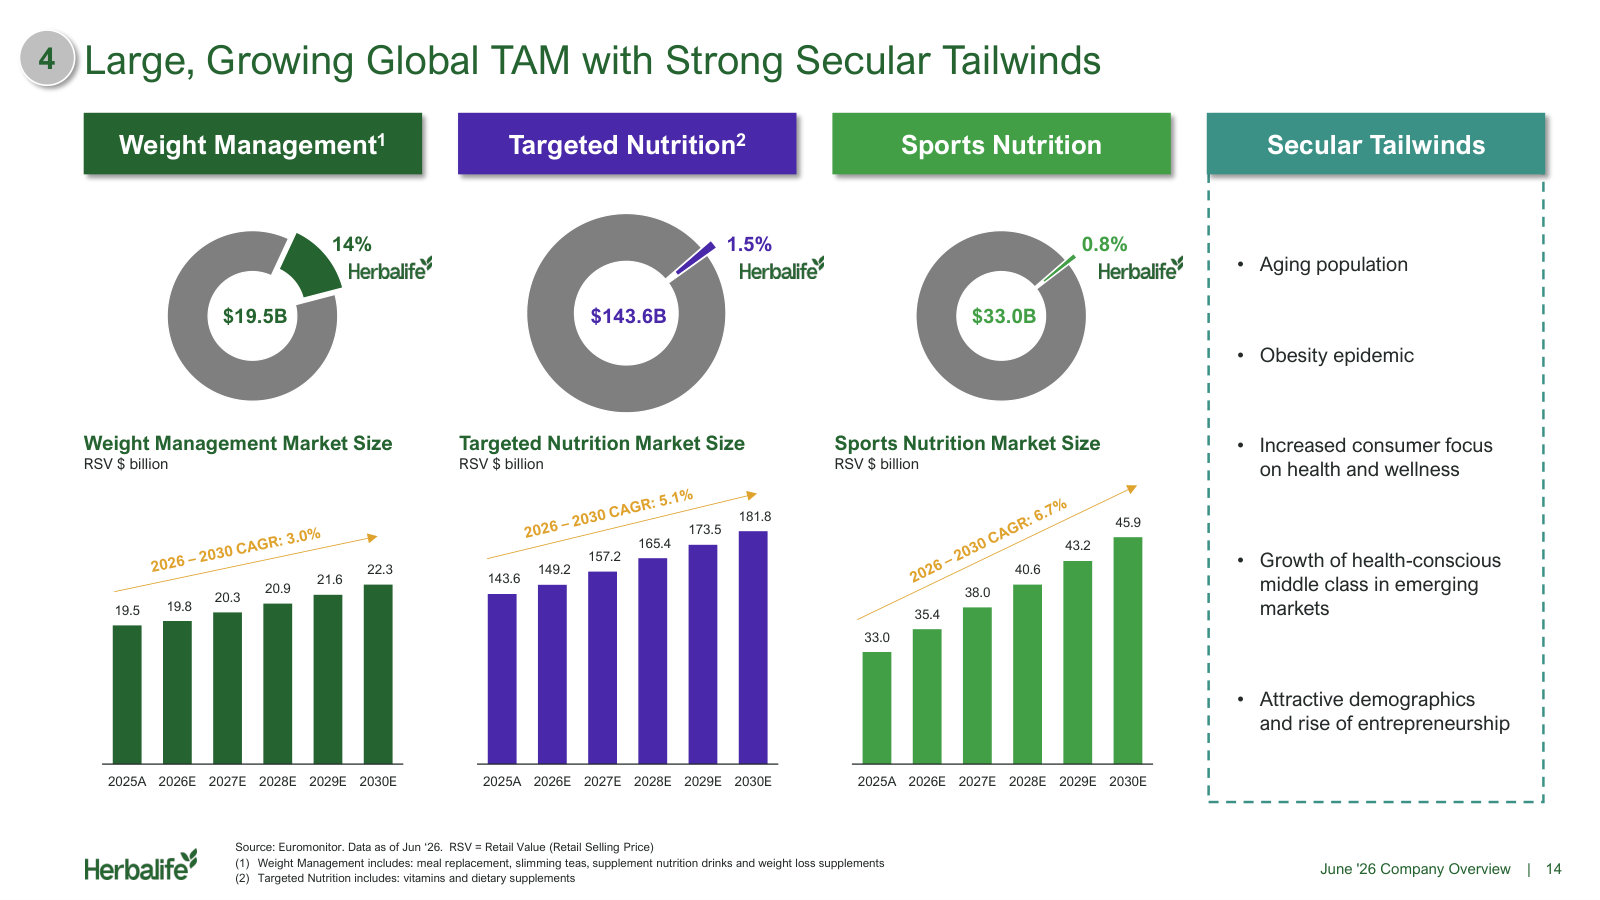
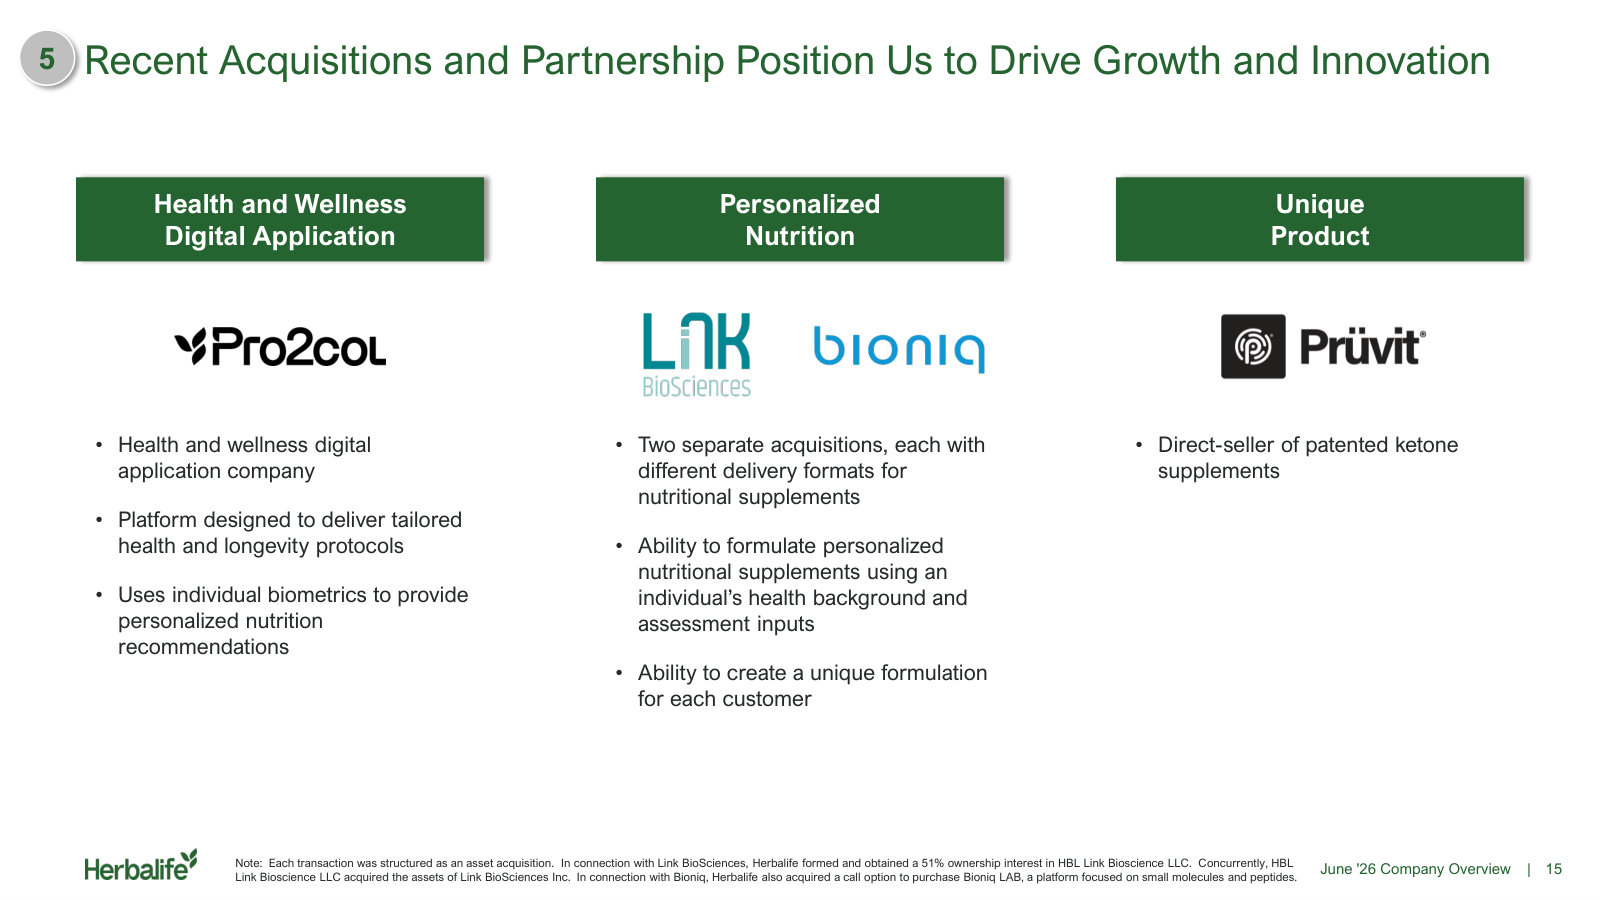
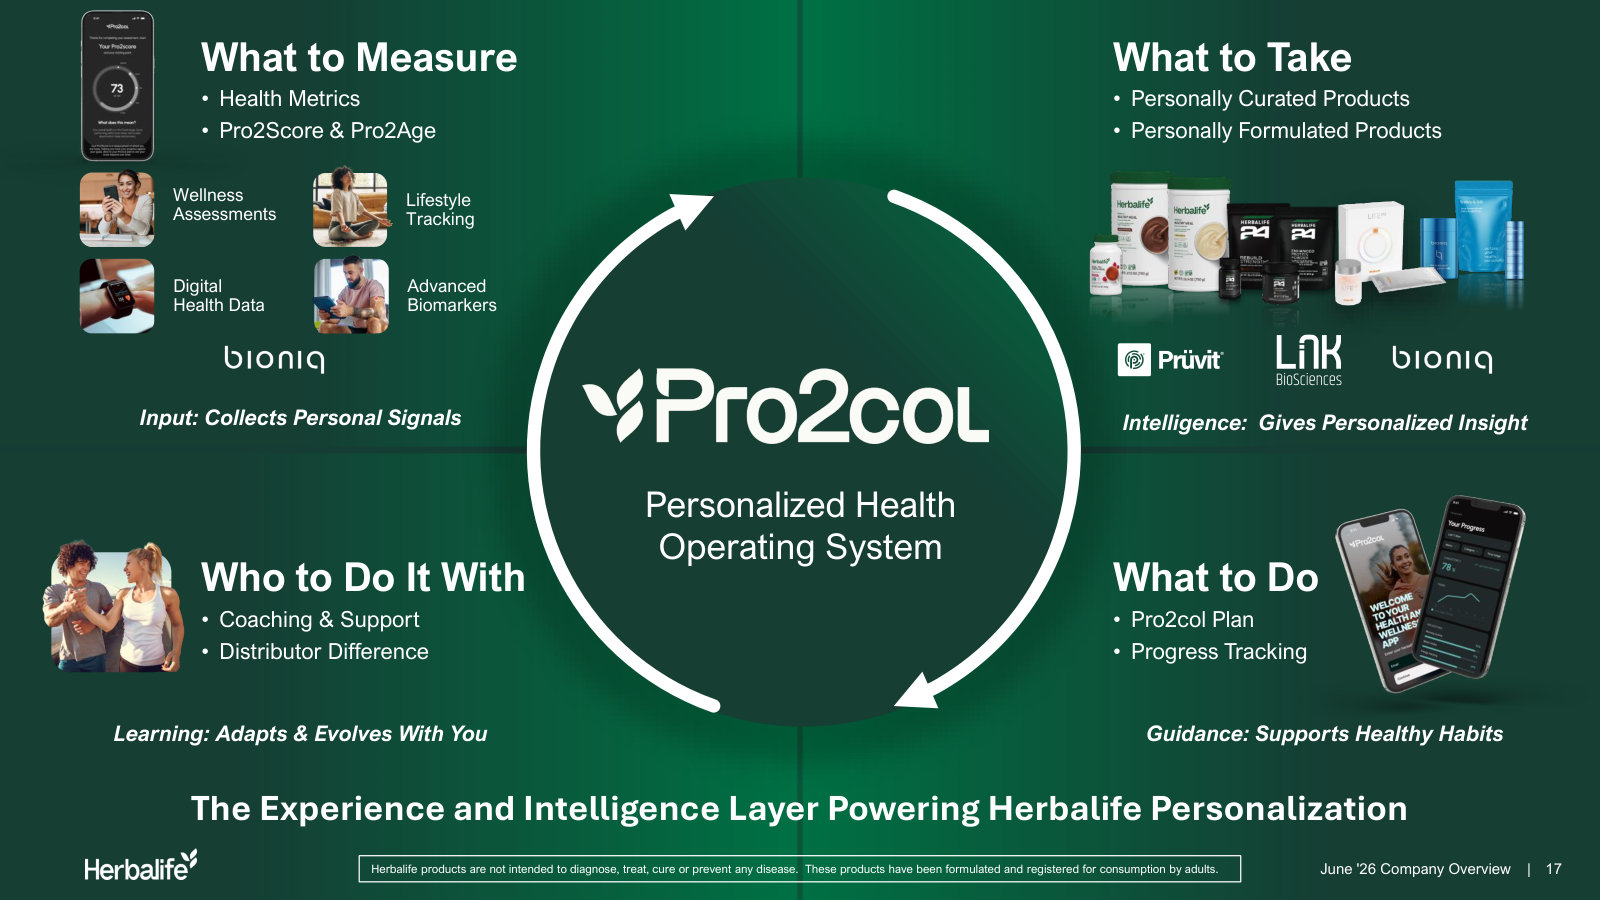
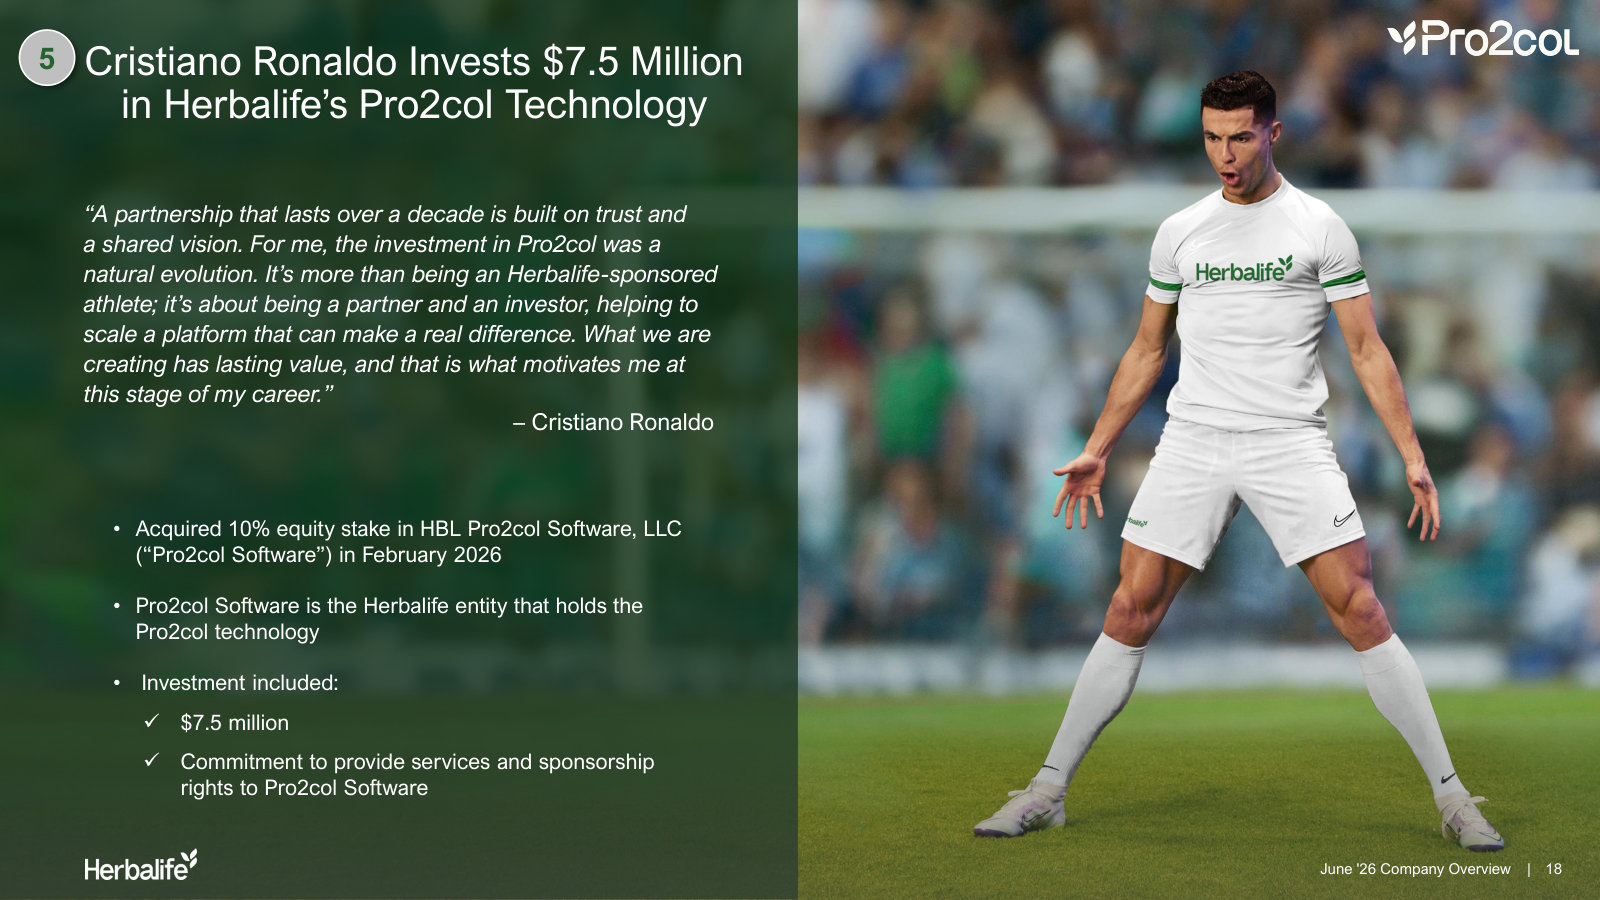
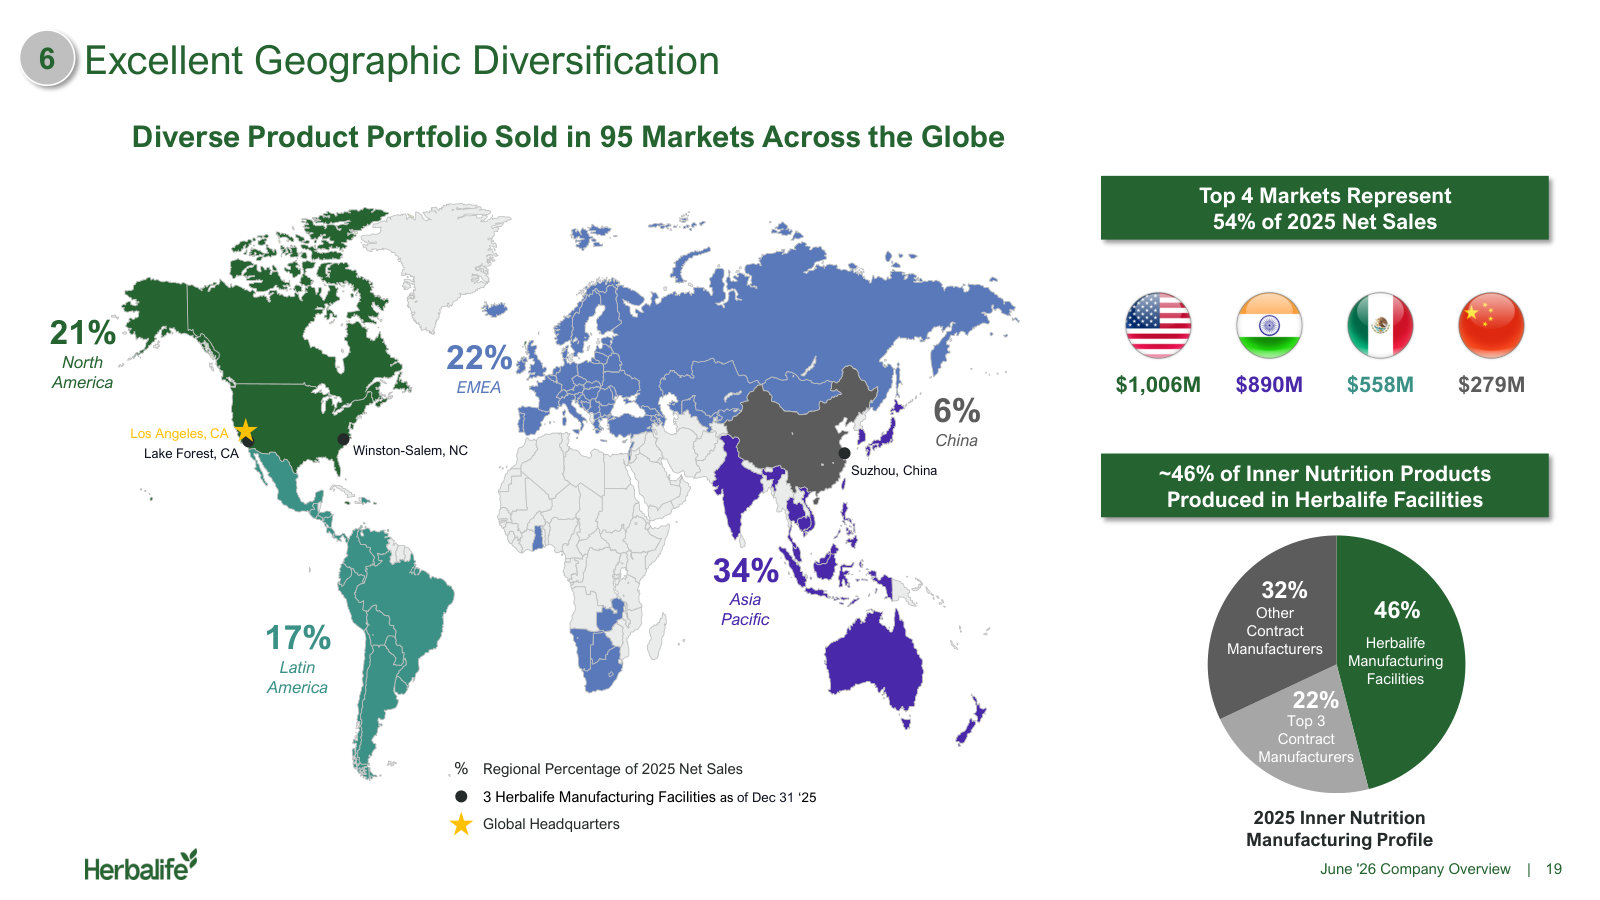
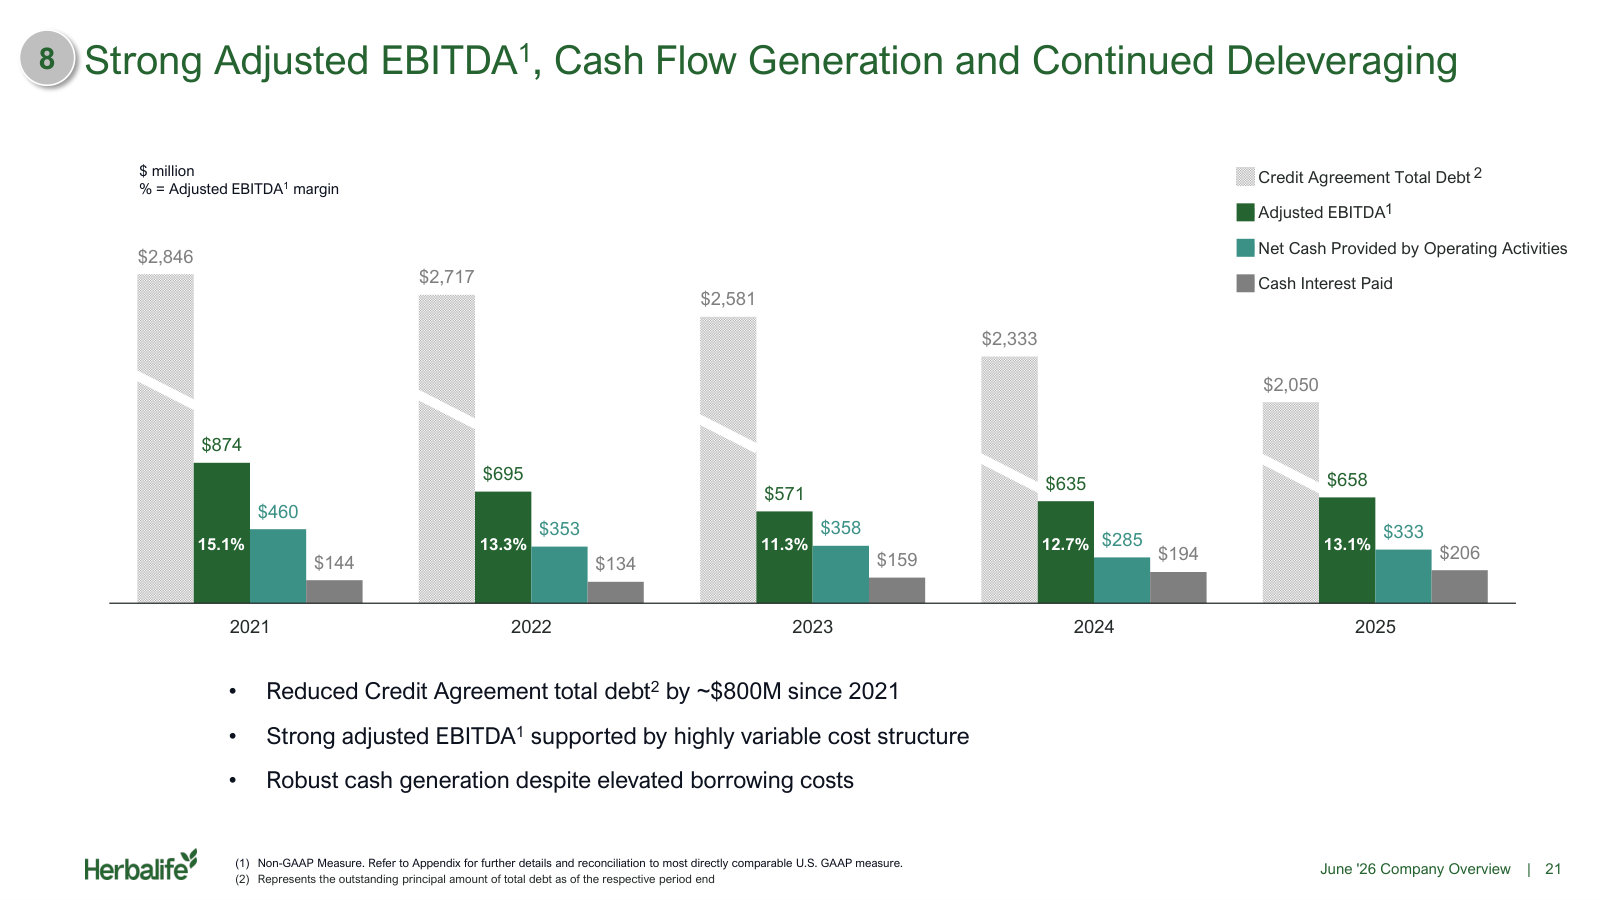
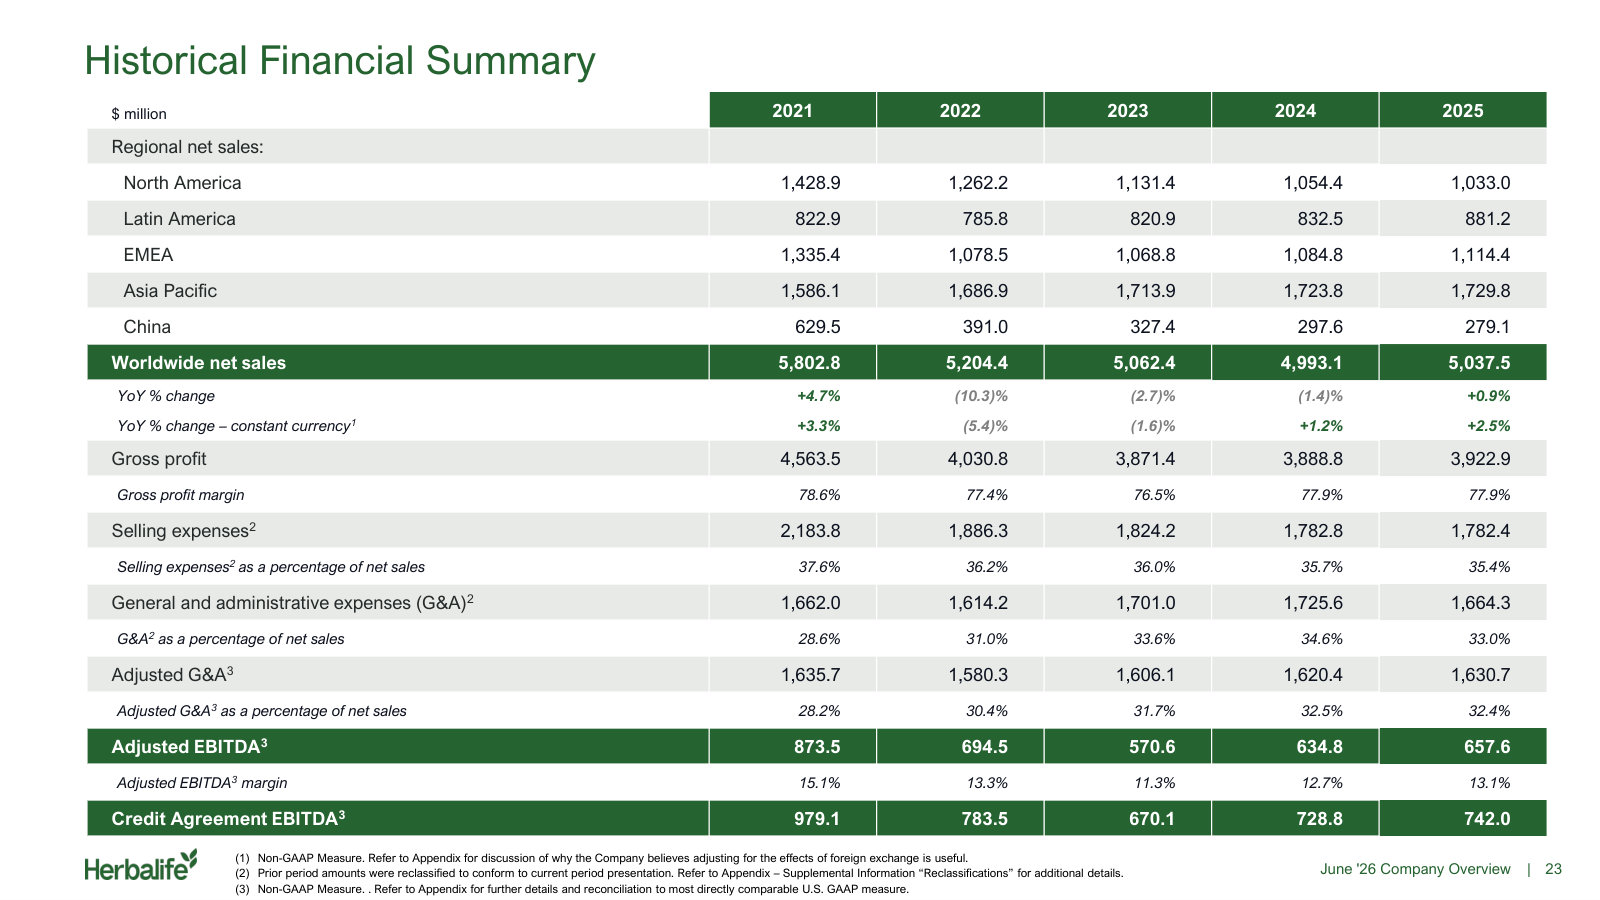
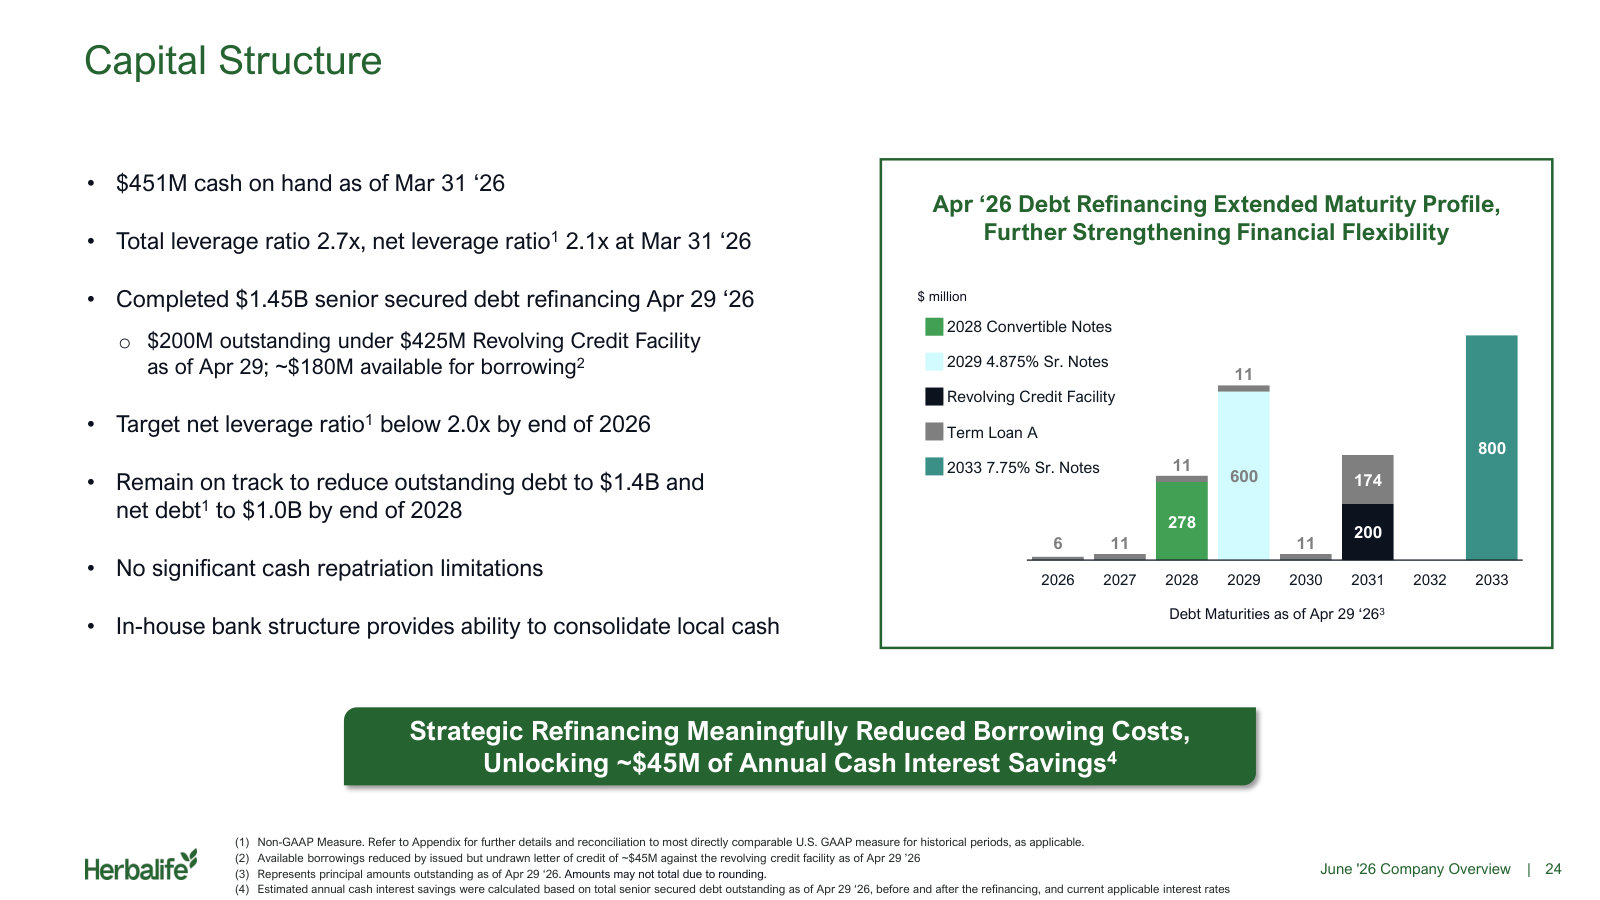
p. 3 — Herbalife at a glance: $5.0B of 2025 net sales, 13.1% adjusted EBITDA margin, and the split by region and product category. · Open the full presentation →p. 5 — The eight-point case management makes for itself, and the roadmap for the rest of the deck. · Open the full presentation →p. 7 — The nutrition club: independently run storefronts selling single servings, the go-to-market format that sets Herbalife apart. · Open the full presentation →p. 8 — Where the ~63,000 clubs sit, plus U.S. club economics: 3.7M customers, 49M transactions, $18.50 average ticket, ~$900M of retail. · Open the full presentation →p. 9 — Sales leader retention by region, 70.3% globally ex-China. The clearest read on whether the distributor base holds together. · Open the full presentation →p. 10 — Market share against named competitors in meal replacement, weight management and protein shakes. · Open the full presentation →p. 11 — Seed-to-Feed: the chain from ingredient sourcing to distribution, and why ~46% of inner nutrition is self-manufactured. · Open the full presentation →p. 13 — The eight brands and four categories the portfolio spans, beyond the core Formula 1 shake. · Open the full presentation →p. 14 — Addressable markets sized with 2026-30 growth rates and Herbalife's share of each: 14% of weight management, 1.5% of targeted nutrition. · Open the full presentation →p. 15 — The recent acquisitions and partnership, Pro2col, Link BioSciences, bioniq and Pruvit, and what each is meant to add. · Open the full presentation →p. 17 — How Pro2col ties measurement, product, coaching and tracking into one loop: the personalization strategy in a single diagram. · Open the full presentation →p. 18 — Ronaldo's $7.5M for 10% of the entity holding the Pro2col technology, an outside mark on the software business. · Open the full presentation →p. 19 — Sales across 95 markets: regional mix, the top four countries at 54% of sales, and the in-house versus contract manufacturing split. · Open the full presentation →p. 21 — Five years of adjusted EBITDA, operating cash flow, cash interest and total debt, the deleveraging story in one chart. · Open the full presentation →p. 23 — Five-year financial summary by region, with gross margin and selling and G&A ratios, the fullest single-page history here. · Open the full presentation →p. 24 — Capital structure after the April 2026 refinancing: maturities, 2.7x total leverage, and the sub-2.0x net leverage target. · Open the full presentation →
The latest reported quarter: current results, the bridges that explain them, the refinanced capital structure and 2026 guidance. · Open the full document →
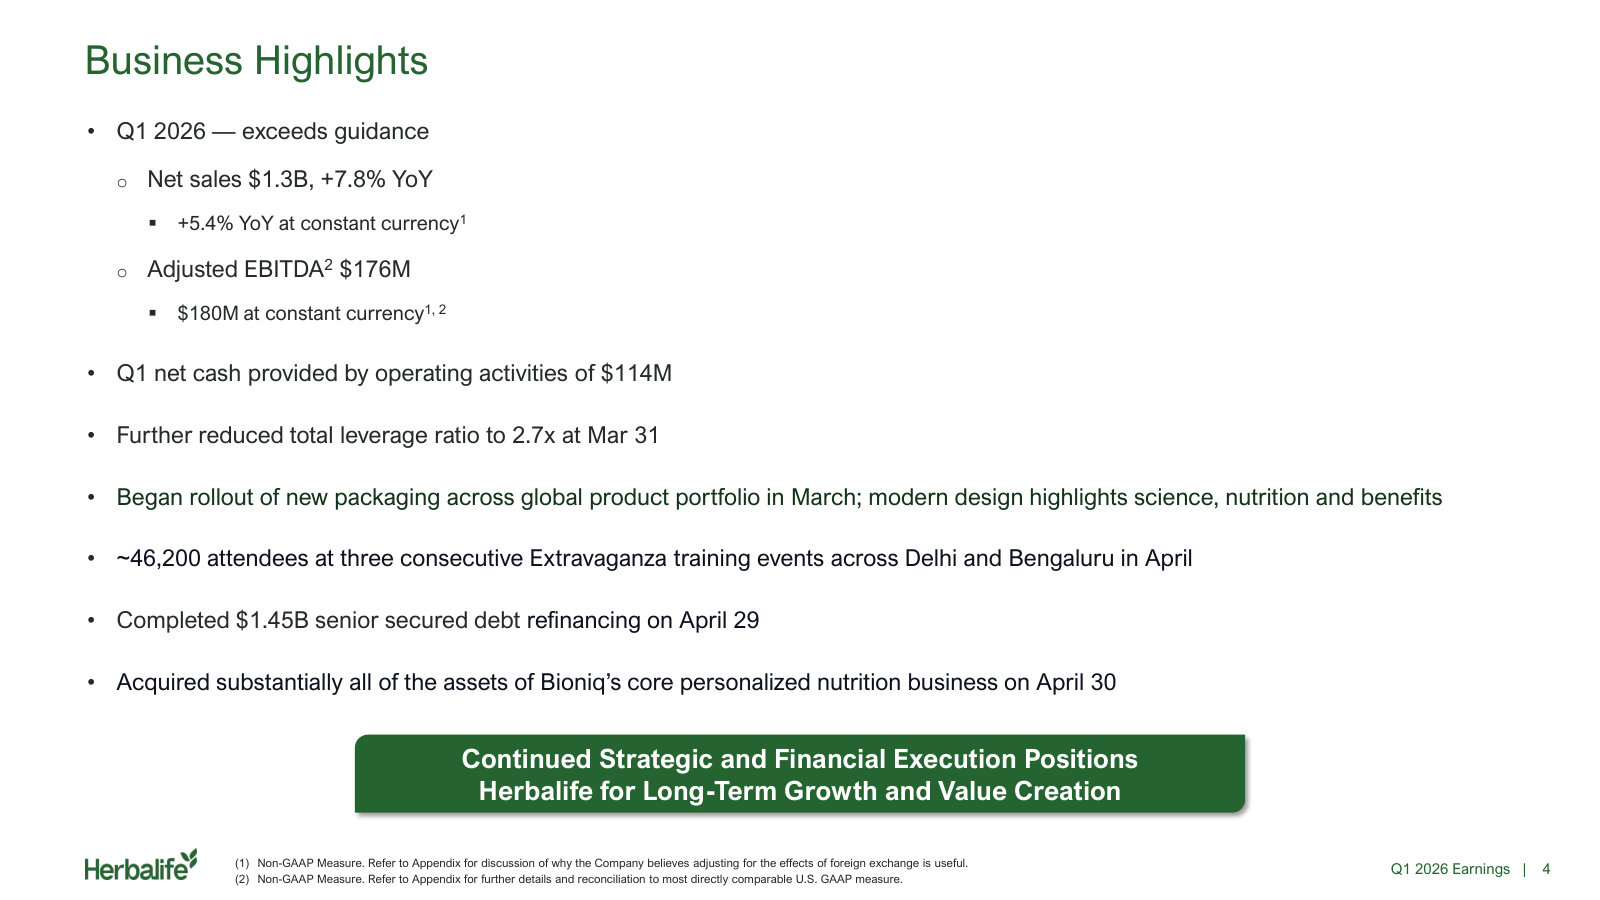
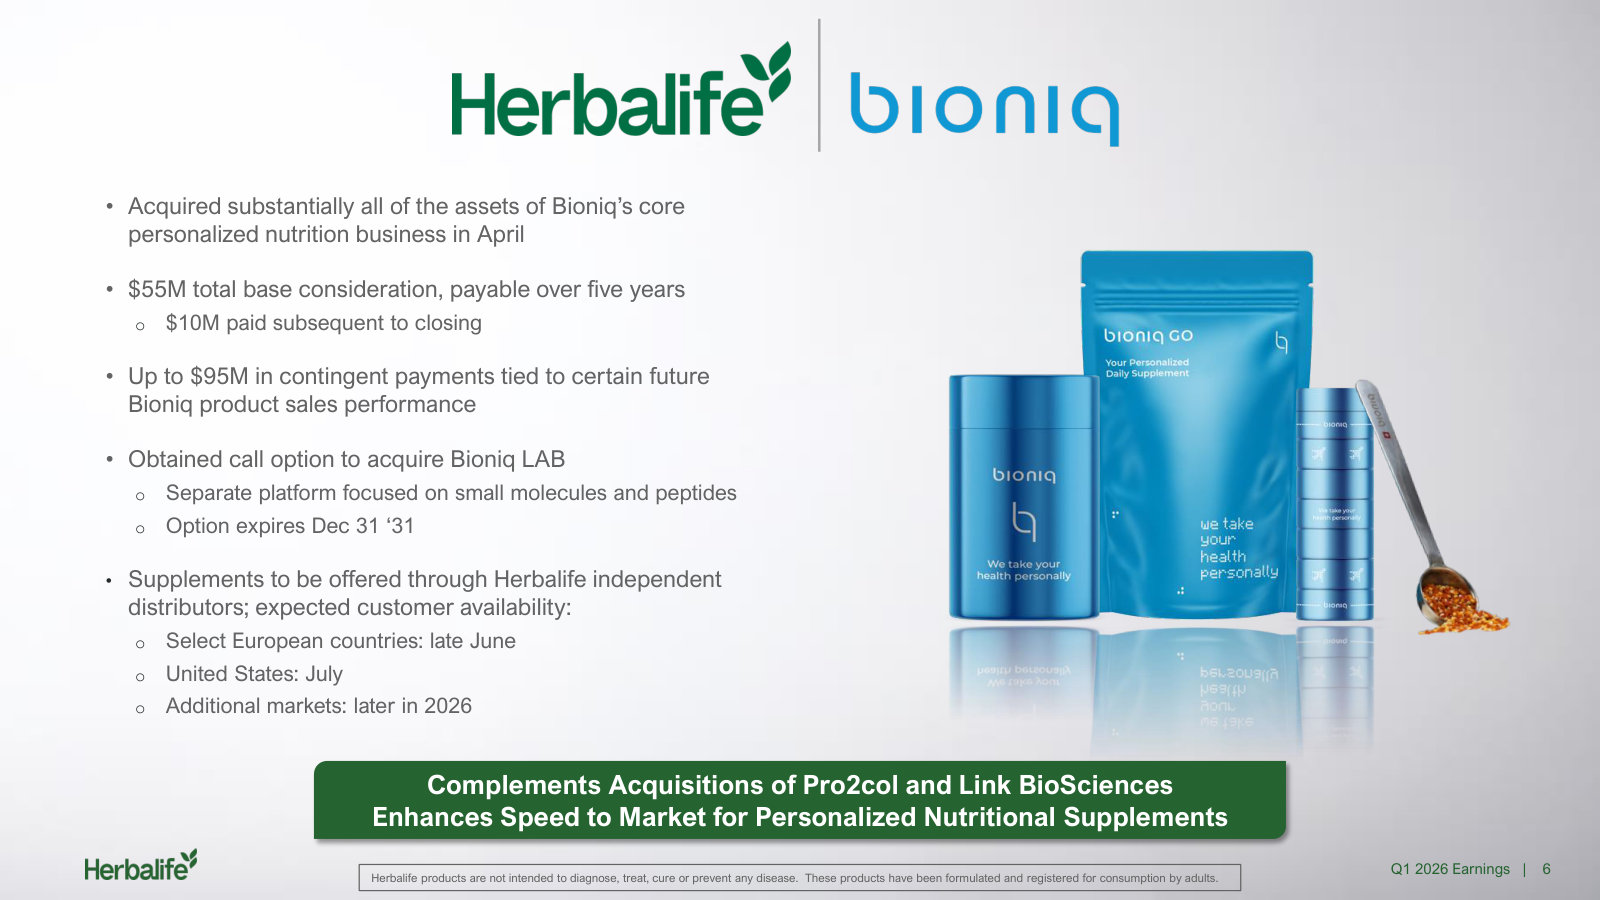
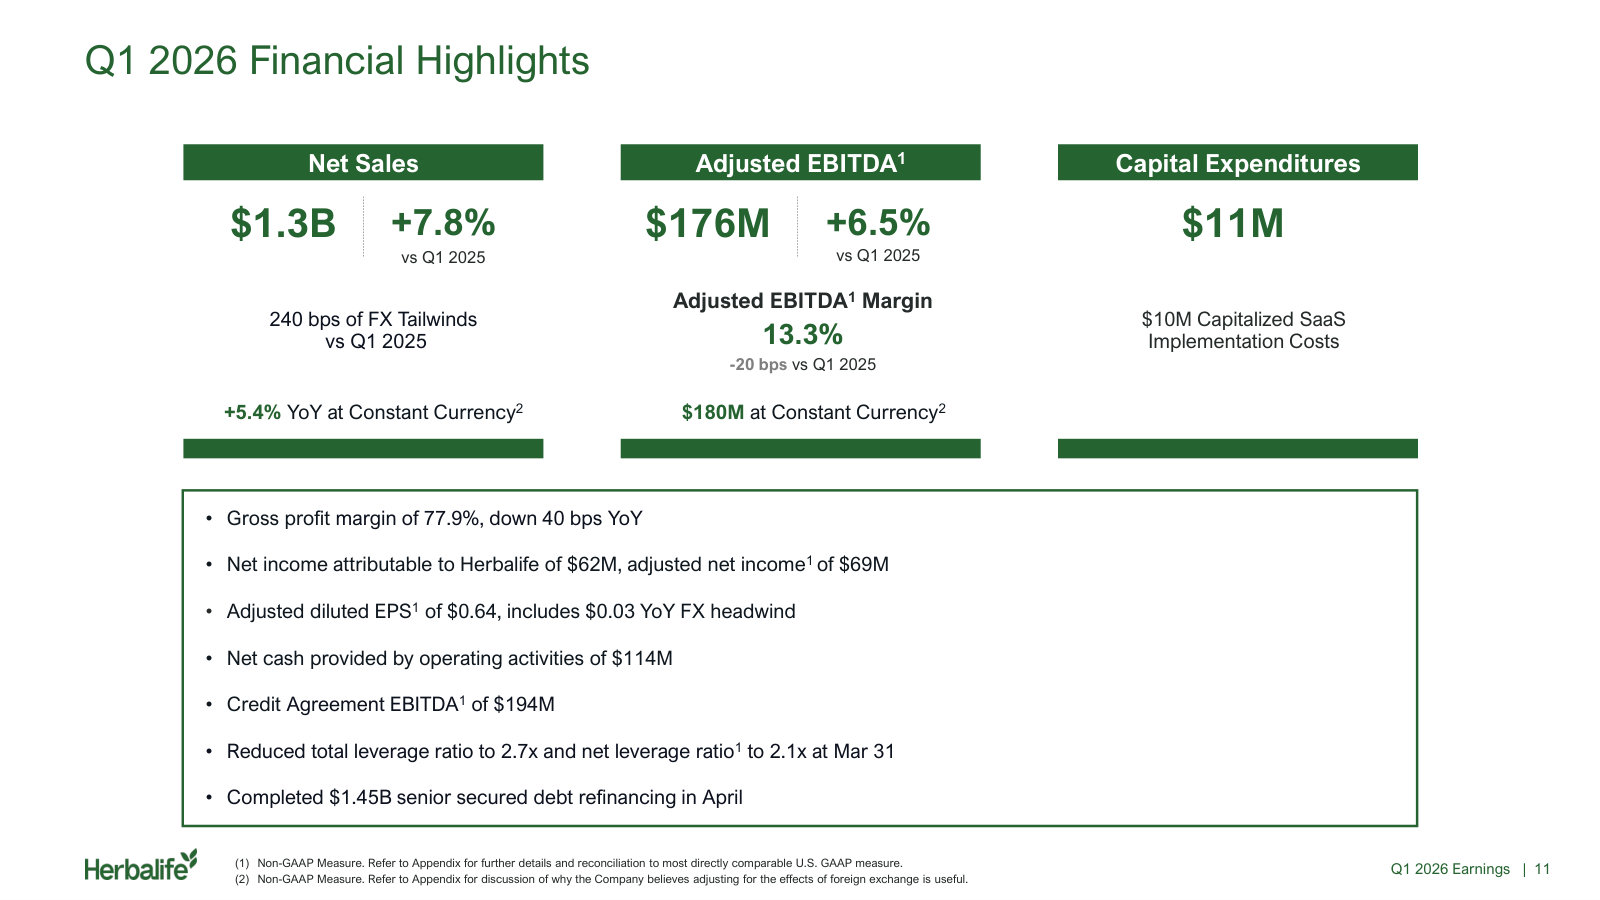
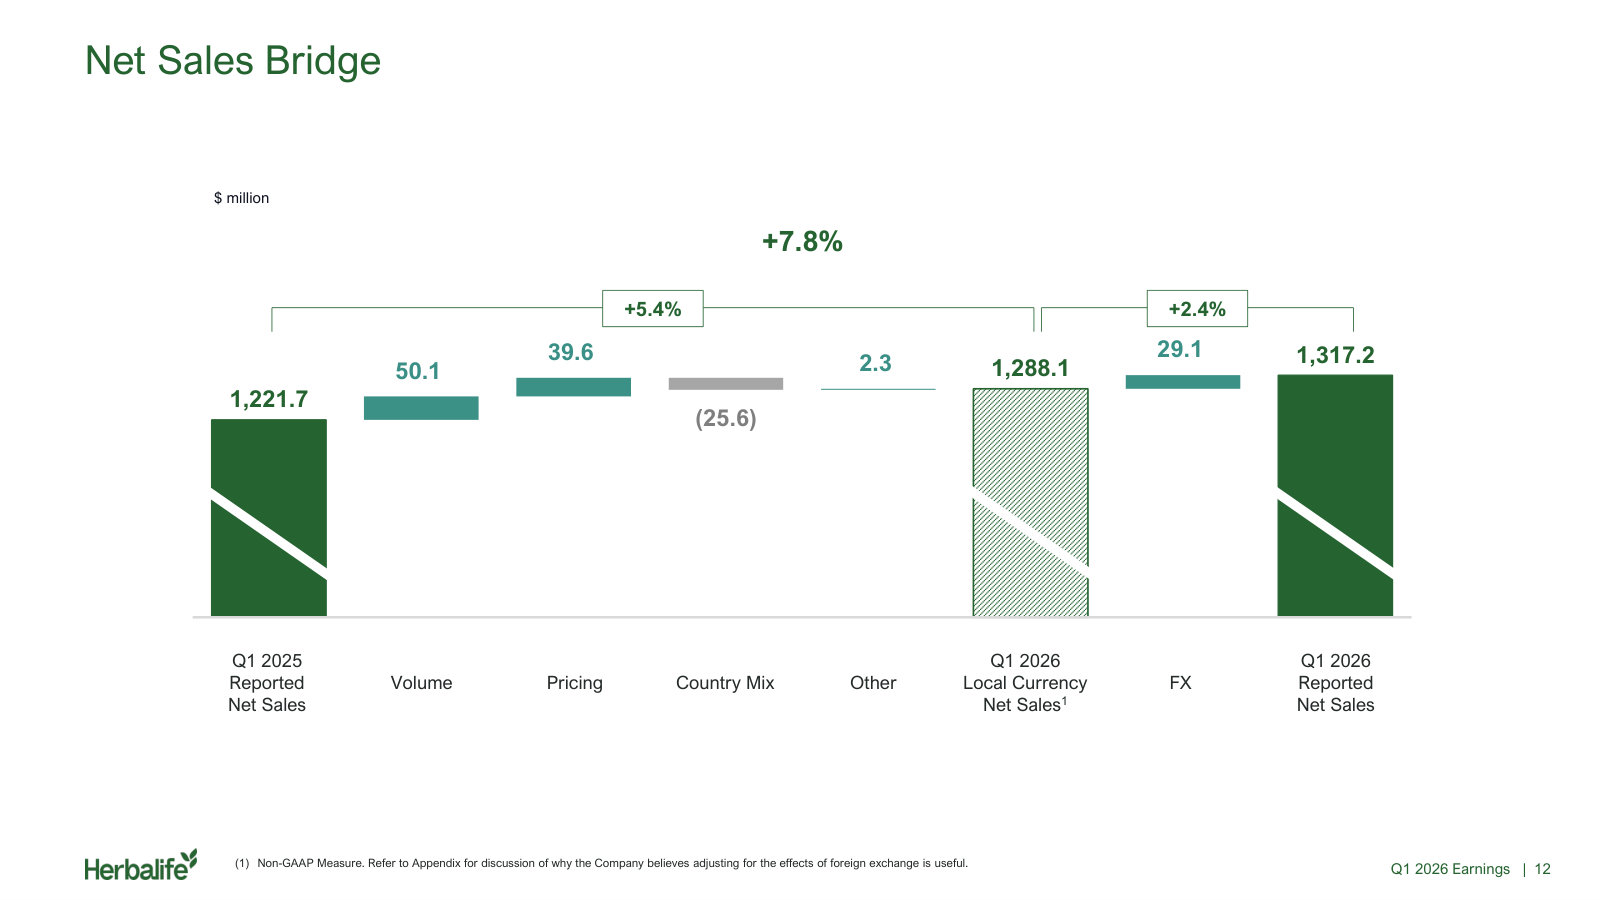
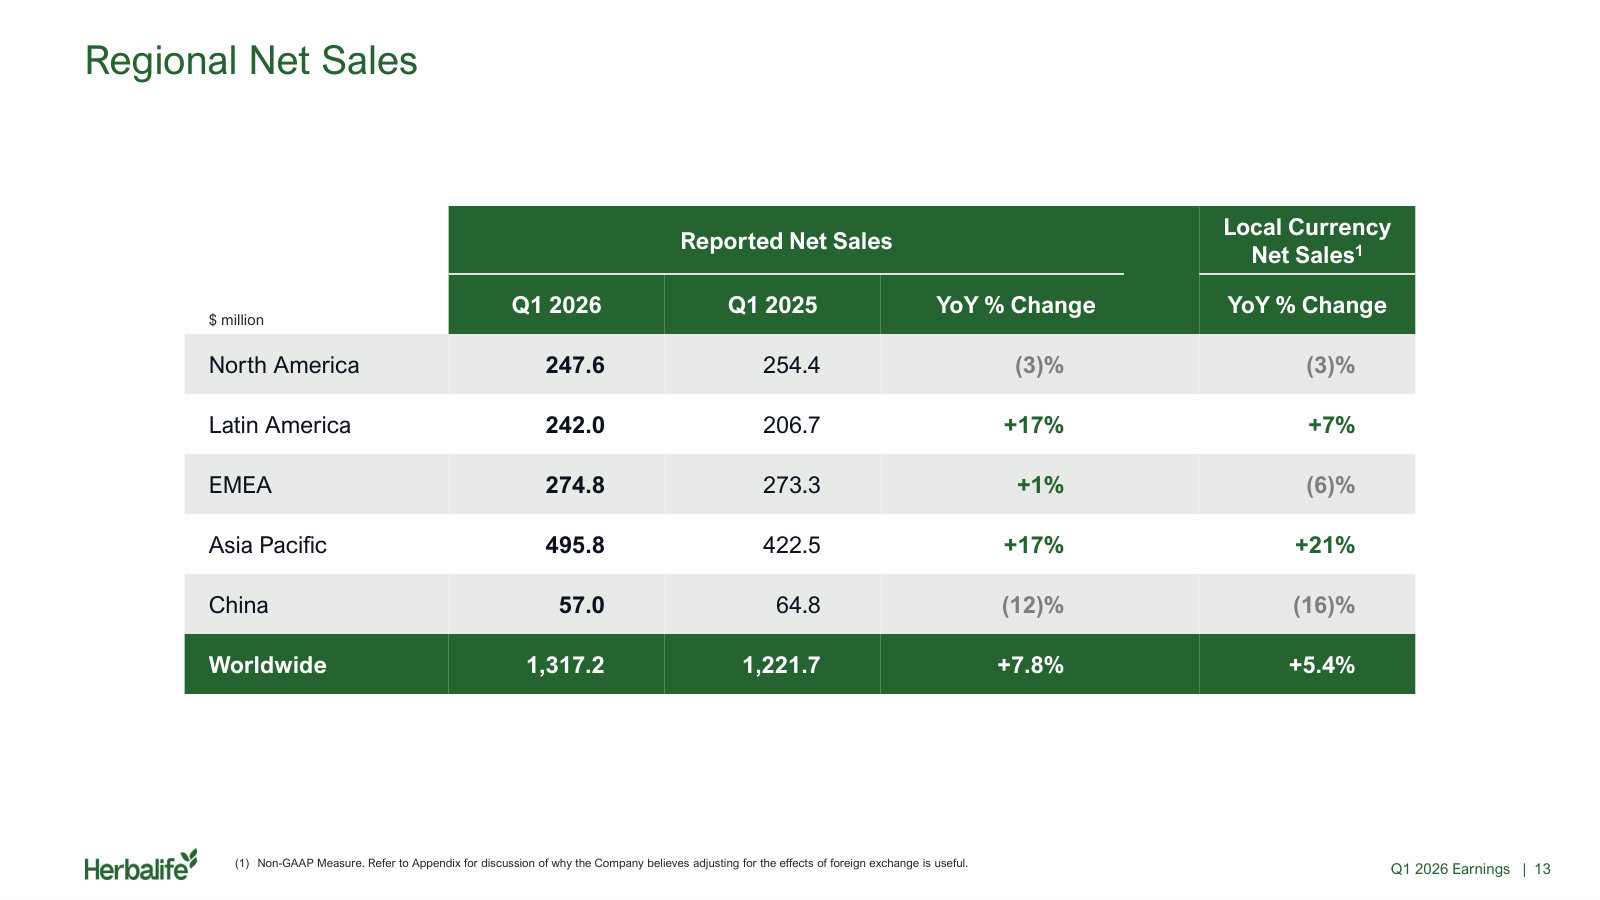
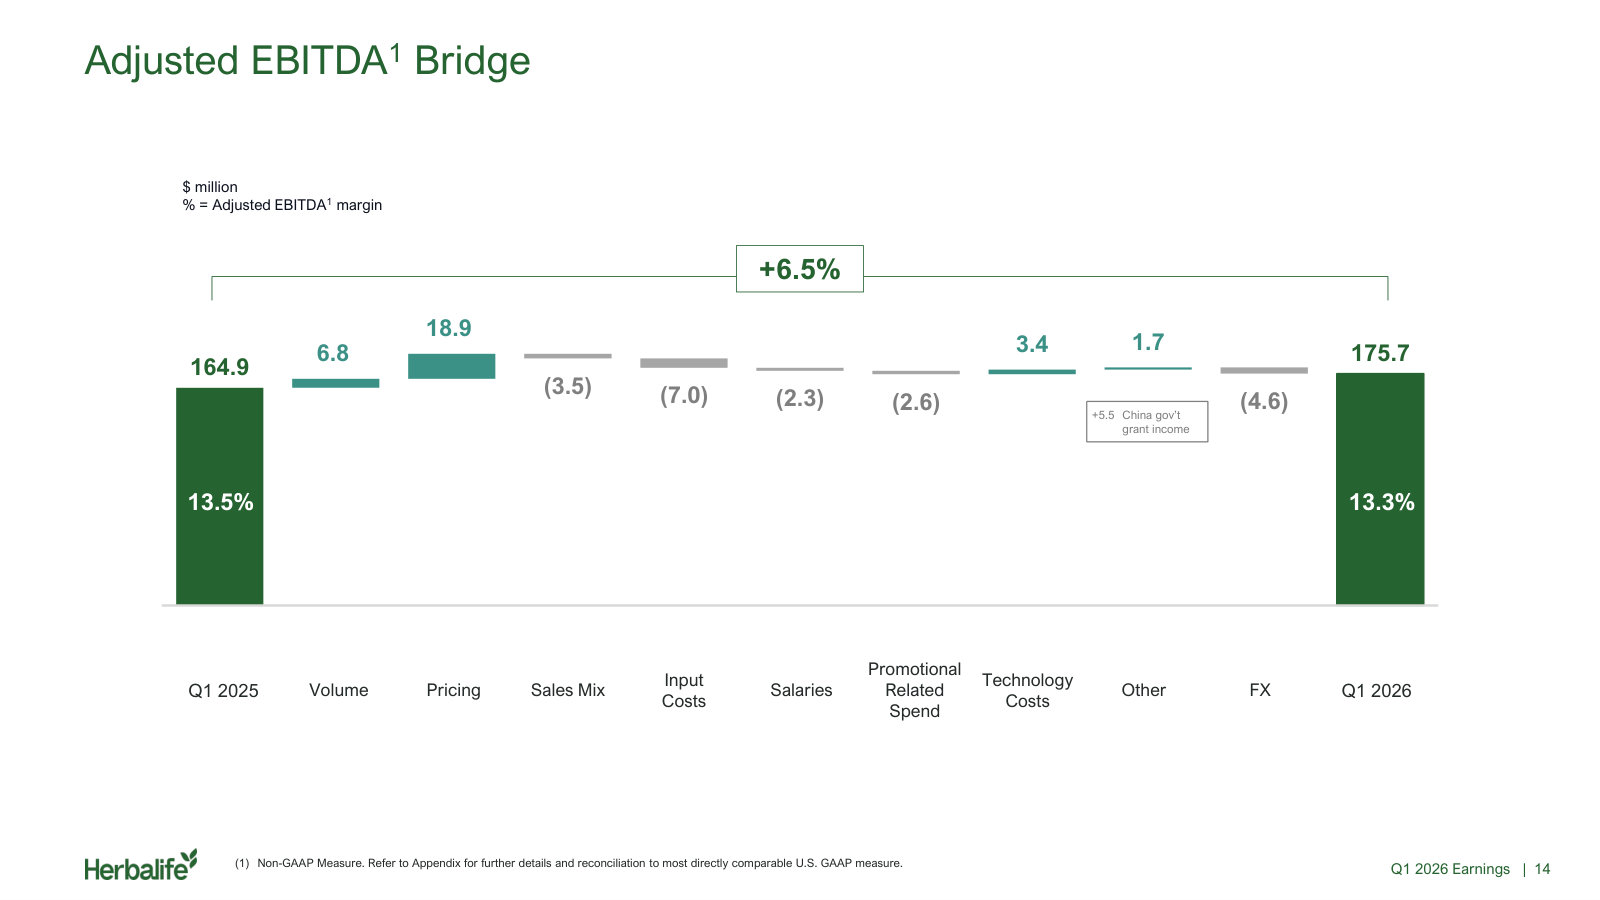
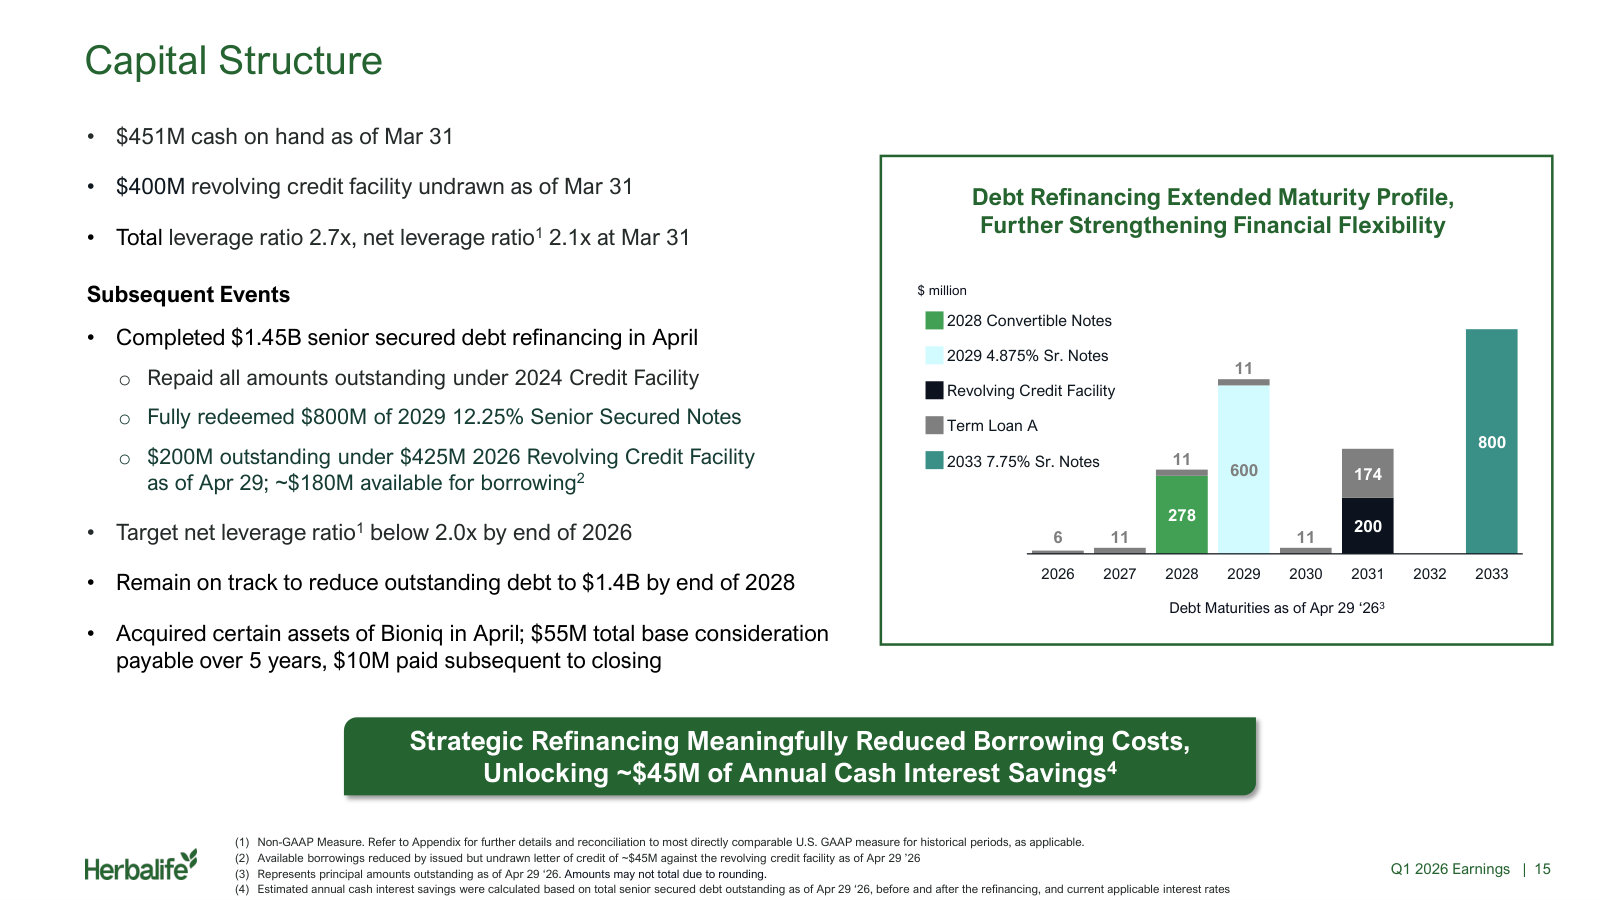
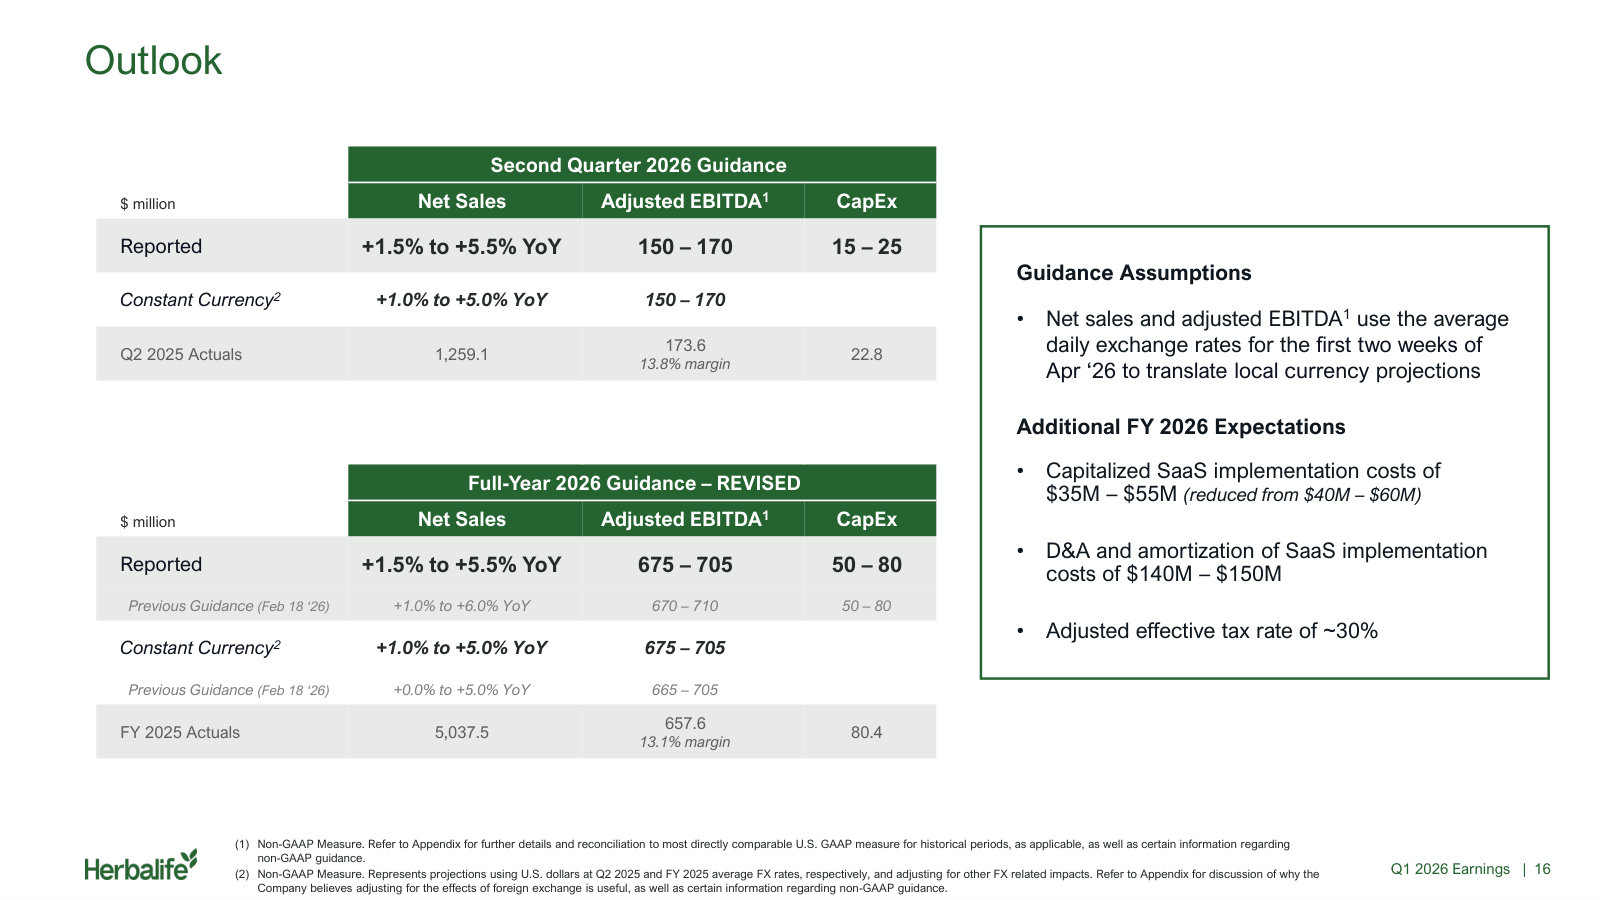
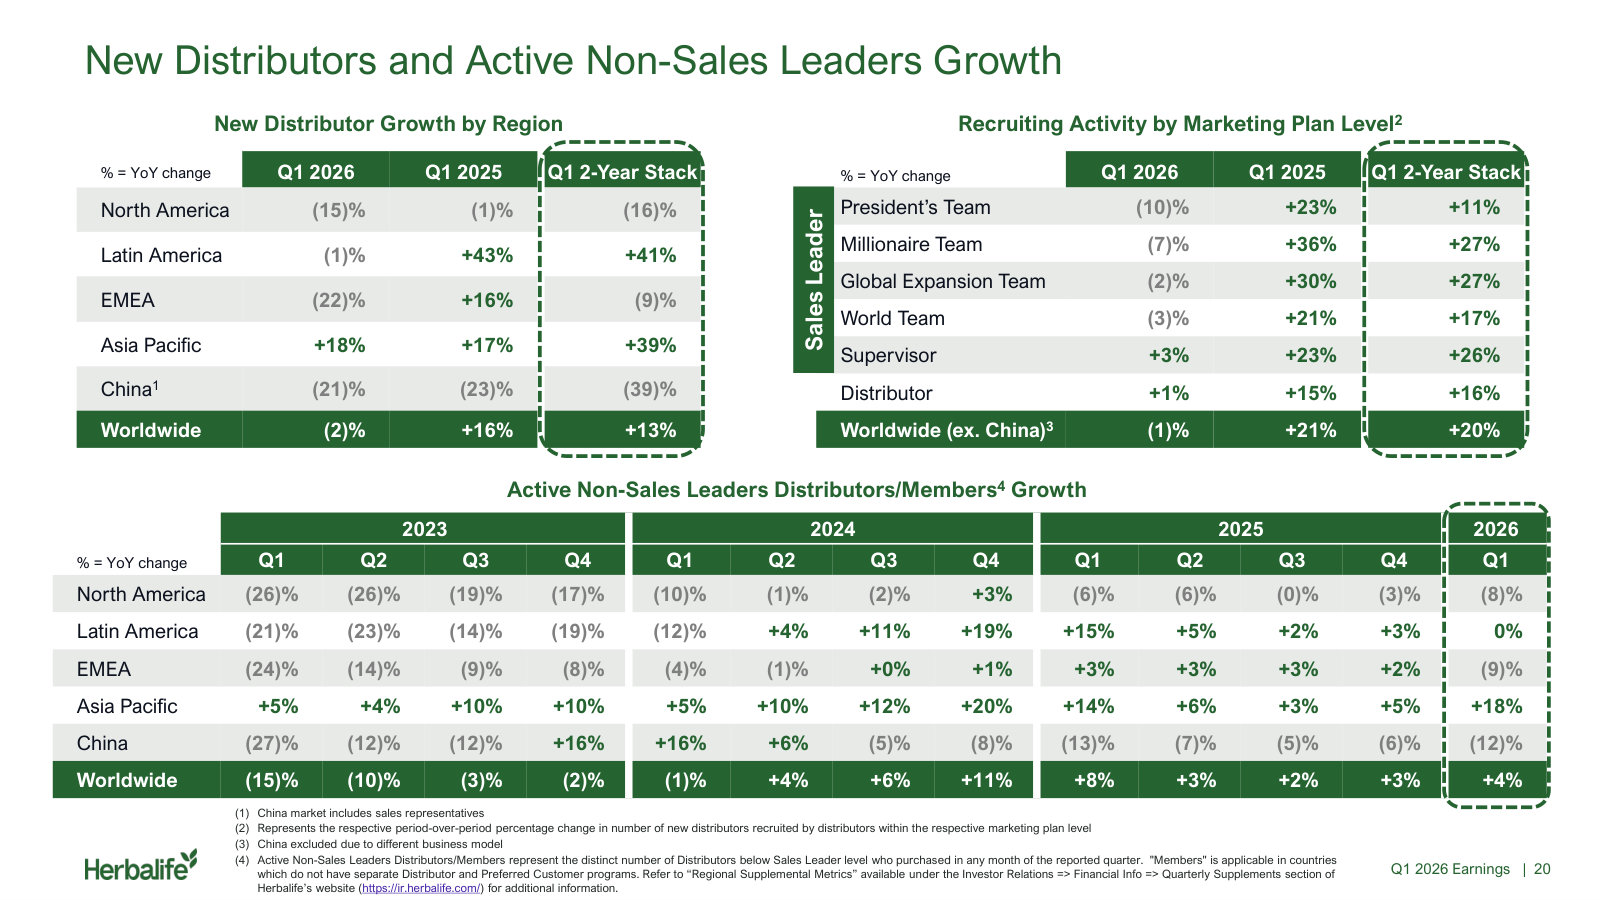
p. 4 — The quarter in management's words: results against guidance, the packaging rollout, the April refinancing and the bioniq closing. · Open the full presentation →p. 6 — The bioniq terms: $55M base over five years, up to $95M contingent, plus a call option on bioniq LAB running to 2031. · Open the full presentation →p. 11 — Q1 2026 scorecard: $1.3B of net sales, $176M adjusted EBITDA at 13.3% margin, leverage down to 2.7x. · Open the full presentation →p. 12 — Net sales bridge: pricing and volume each added, country mix subtracted, FX contributed 2.4 points of the 7.8% growth. · Open the full presentation →p. 13 — Net sales by region, reported and in local currency: Asia Pacific up 21%, China down 16%. · Open the full presentation →p. 14 — Adjusted EBITDA bridge: pricing carried the quarter against input costs, salaries and technology spend. · Open the full presentation →p. 15 — Post-refinancing maturity profile and the path to $1.4B of debt by 2028, worth ~$45M of annual interest savings. · Open the full presentation →p. 16 — Q2 and revised full-year 2026 guidance, with the FX, capex and SaaS-cost assumptions behind it. · Open the full presentation →p. 20 — The distributor funnel: new recruits by region and by marketing-plan level, with three years of active-member growth. · Open the full presentation →
The full-year 2025 scorecard and the bridges showing what drove the year, the base against which 2026 guidance is set. · Open the full document →
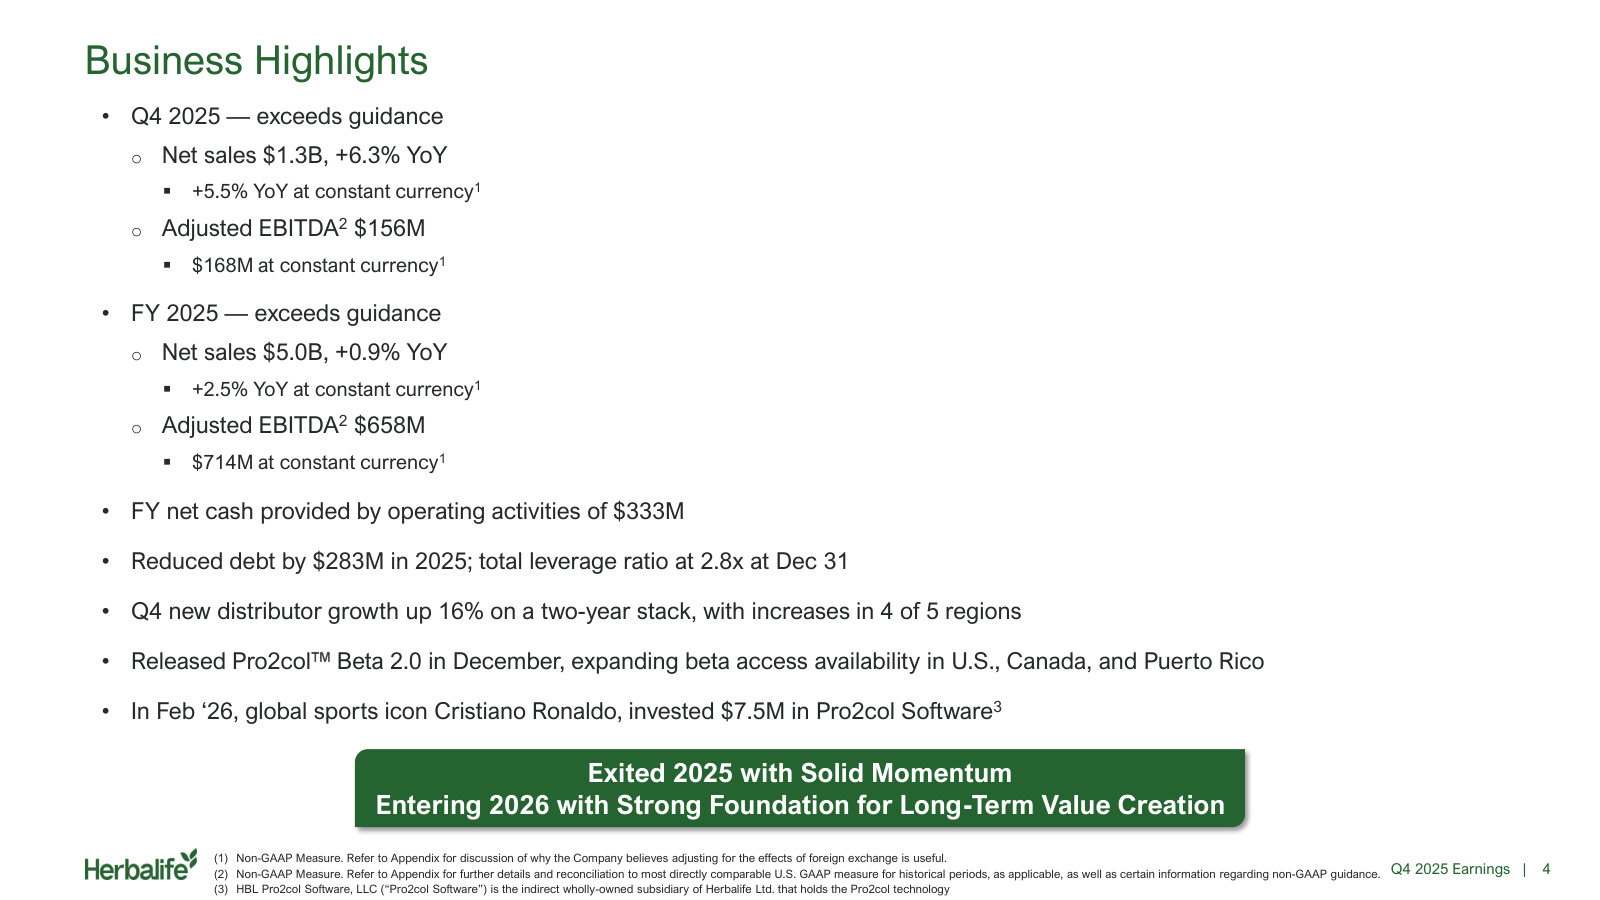
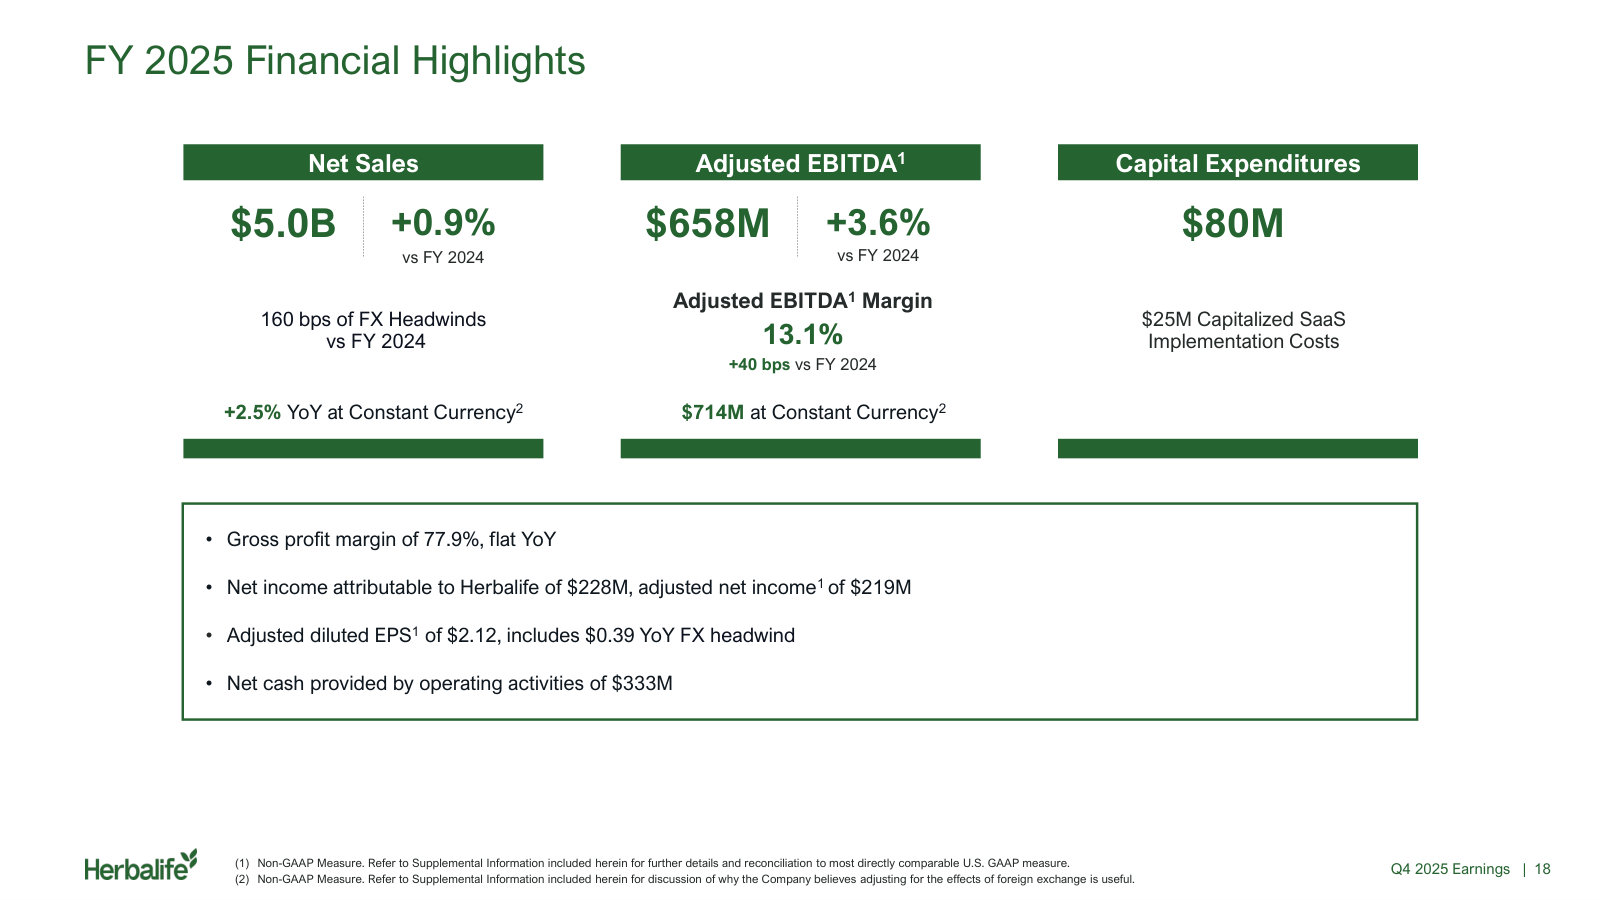
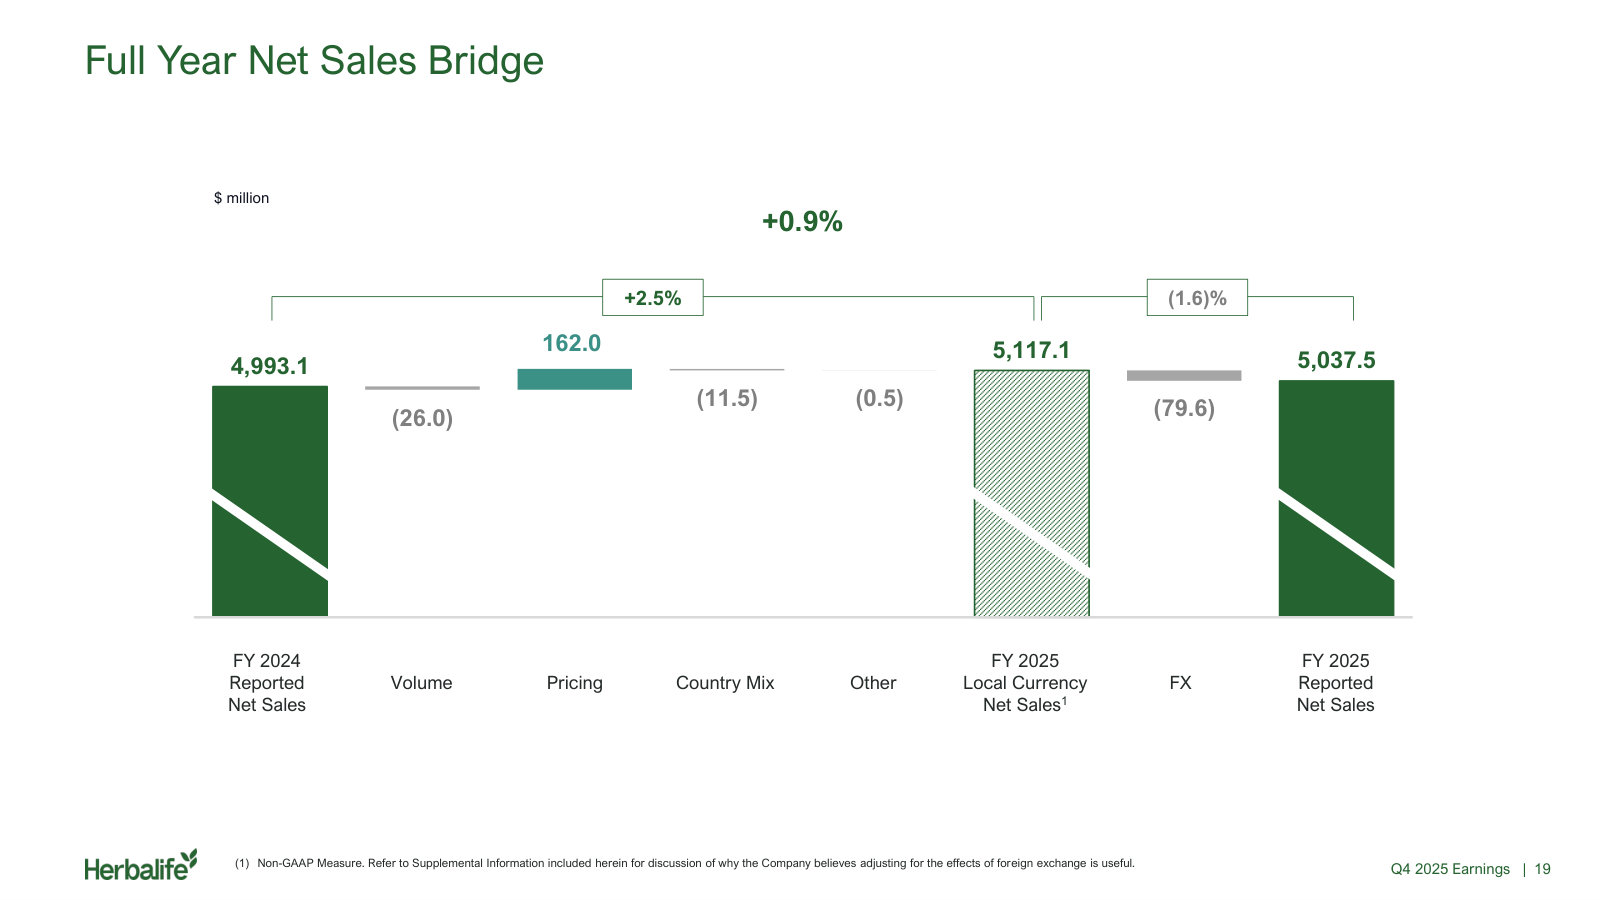
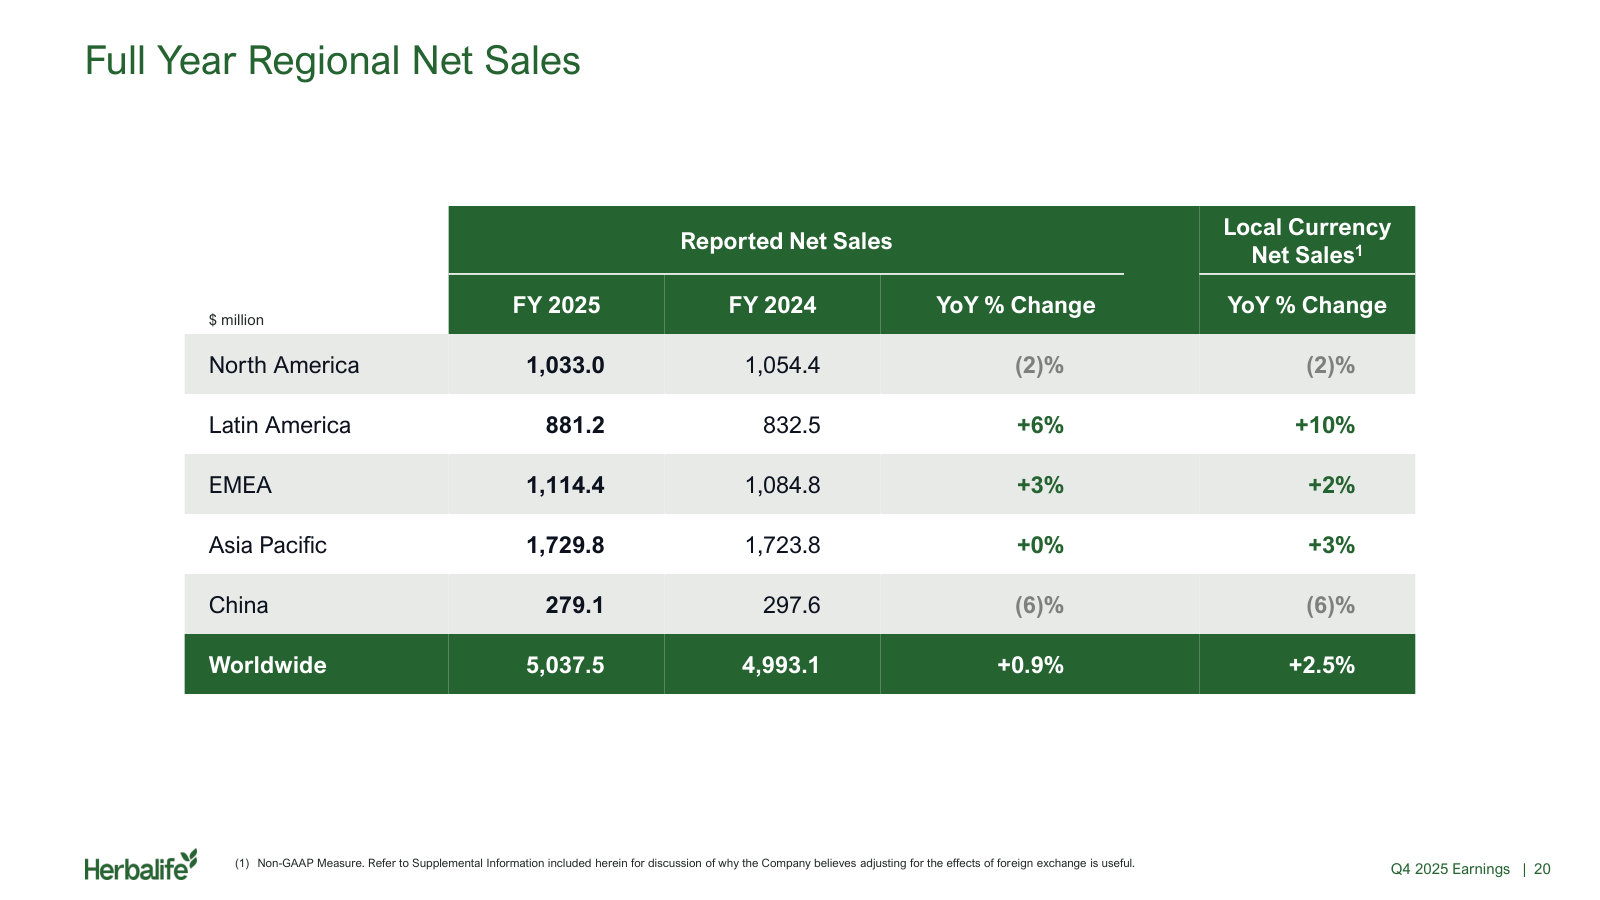
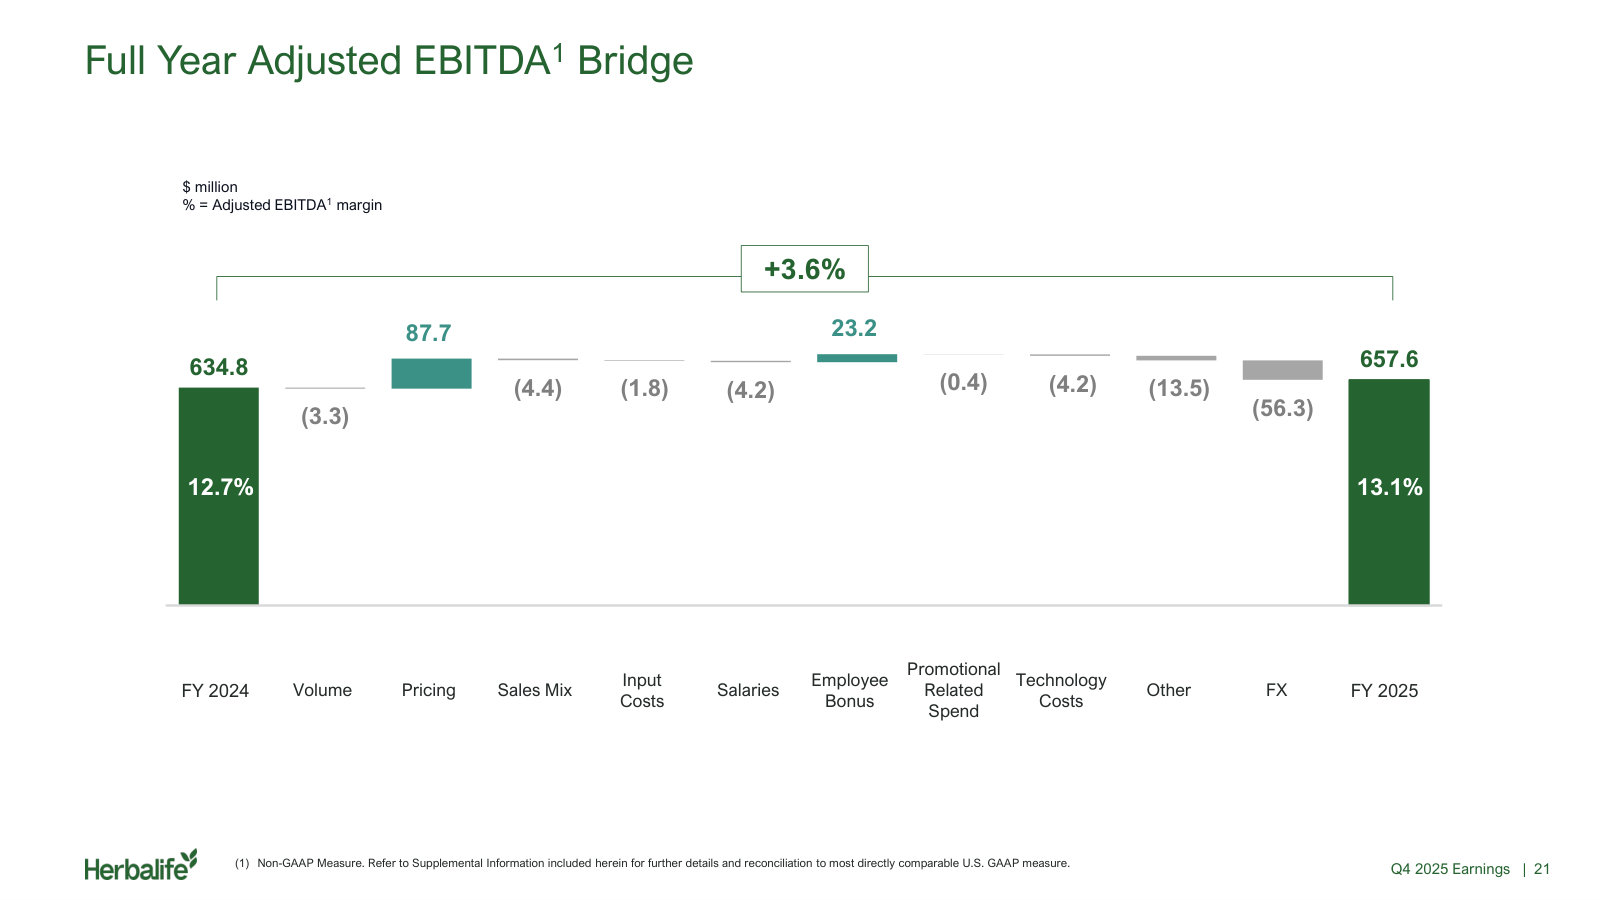
p. 4 — Q4 and full-year 2025 against guidance, plus the debt reduction and Pro2col milestones management chose to lead with. · Open the full presentation →p. 18 — FY 2025 in numbers: $5.0B of net sales, $658M adjusted EBITDA at 13.1% margin, $333M of operating cash flow. · Open the full presentation →p. 19 — Full-year net sales bridge: pricing added $162M while volume fell, the clearest view of how growth was actually made. · Open the full presentation →p. 20 — Full-year net sales by region, reported and local currency: Latin America up 10%, China down 6%. · Open the full presentation →p. 21 — Full-year adjusted EBITDA bridge: pricing and lower employee bonus against FX, technology and input costs. · Open the full presentation →
Q3 2025 Earnings Presentation — Q3 2025 · 28 pages · Pro2col Beta 2.0 ahead of commercial release, and the new Torrance center of excellence. · Open →
Q2 2025 Earnings Presentation — Q2 2025 · 29 pages · Where management first laid out what Pro2col is and how the platform is meant to work. · Open →
Q4 and Full-Year 2024 Earnings Presentation — Q4 / FY 2024 · 25 pages · FY 2024 results and the leadership handover, with Gratziani named CEO effective May 2025. · Open →
Q3 2024 Earnings Presentation — Q3 2024 · 27 pages · The last quarter run by the prior CEO, with the EMEA product and packaging relaunch. · Open →
Q4 and Full-Year 2023 Earnings Presentation — Q4 / FY 2023 · 27 pages · FY 2023, the trough year in this five-year history, and the GLP-1 companion product response. · Open →