Full Report
The numbers behind Herbalife Ltd.: as-reported financial statements and company metrics for FY2021–FY2025, traced to the source filings, opened with the share-price history those statements have to justify. Every linked figure opens the exact page of the filing it was printed on, with the statement row highlighted. Amounts in US$ millions unless noted.
Reading notes: Revenue is disaggregated three ways because Herbalife reports and discusses all three: by geographic region (the hero cut, and the basis of its operating segments), by product line, and by reporting segment (Primary Reporting Segment versus China). In the FY2025 10-K Herbalife renamed Royalty overrides to member compensation and re-cut its operating expenses into Selling expenses and General and administrative expenses; FY2023 and FY2024 were revised onto that basis. FY2021 and FY2022 are shown on the prior Royalty overrides / Selling, general, and administrative expenses basis exactly as printed in the FY2022 10-K, on their own rows. Total operating expense is unaffected by the reclassification. FY2016-FY2018 rows of the Long-Term Record come from the standardized SEC XBRL data feed and carry no page links. FY2019 and FY2020 are comparative columns of the FY2021 10-K and are linked. Net income for FY2025 is the consolidated 227.8 as printed; net income attributable to Herbalife was 228.3, and diluted EPS of 2.20 is computed on the attributable figure.
Share Price — Full Available History — 22 Years
The stock closed at $12.18 on Jul 27, 2026 — up 231% over the window shown (+5.7% a year), trading between $3.07 and $61.47. At that close the stock trades at 5.5× FY2025 diluted EPS as reported below.
Source: market price feed, monthly closes, sampled from 5,436 source observations, Dec 2004–Jul 2026. Price return only, excludes dividends.
Market capitalization $2.1bn and enterprise value $3.7bn.
Market cap = 172.2M shares outstanding × the Jul 27, 2026 close of $12.18. Enterprise value adds total debt of $2.0bn and subtracts cash and equivalents of $353mn (net debt of $1.6bn), from the FY2025 balance sheet. Market-derived figures, shown without filing links.
FY2025 at a Glance
Revenue (US$ millions)
Operating income (US$ millions)
Net income (US$ millions)
Diluted EPS
Source: FY2025 consolidated statements [1] [2]. Click any linked figure to open the filing page with the row highlighted.
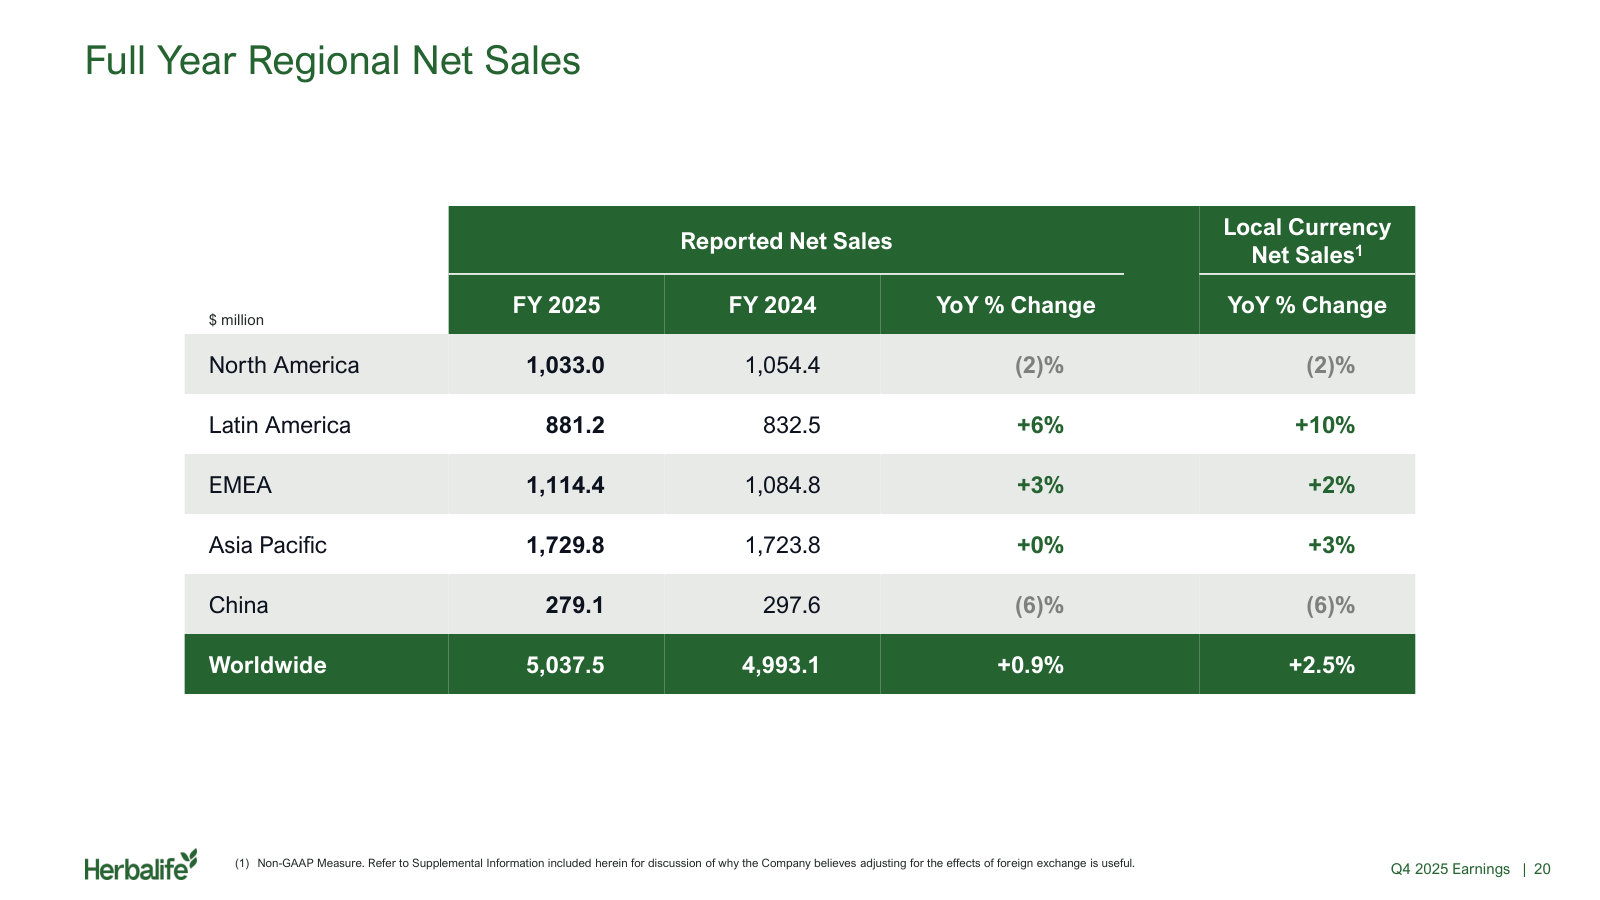
Net Sales by Geographic Region
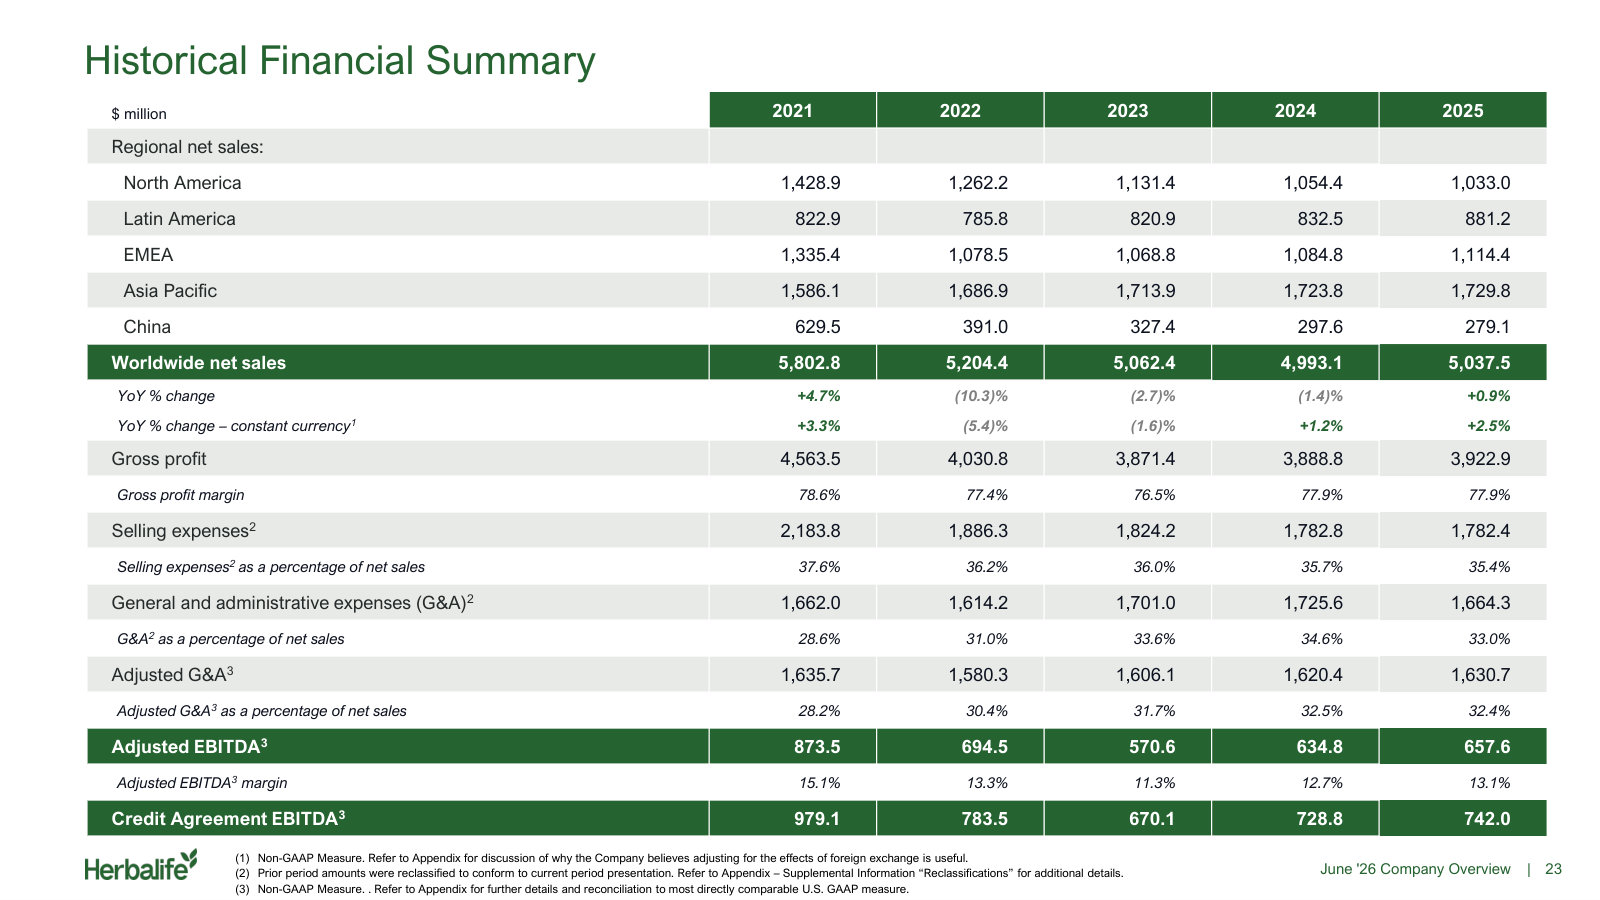
| Net Sales by Geographic Region | FY2021 | FY2022 | FY2023 | FY2024 | FY2025 |
|---|---|---|---|---|---|
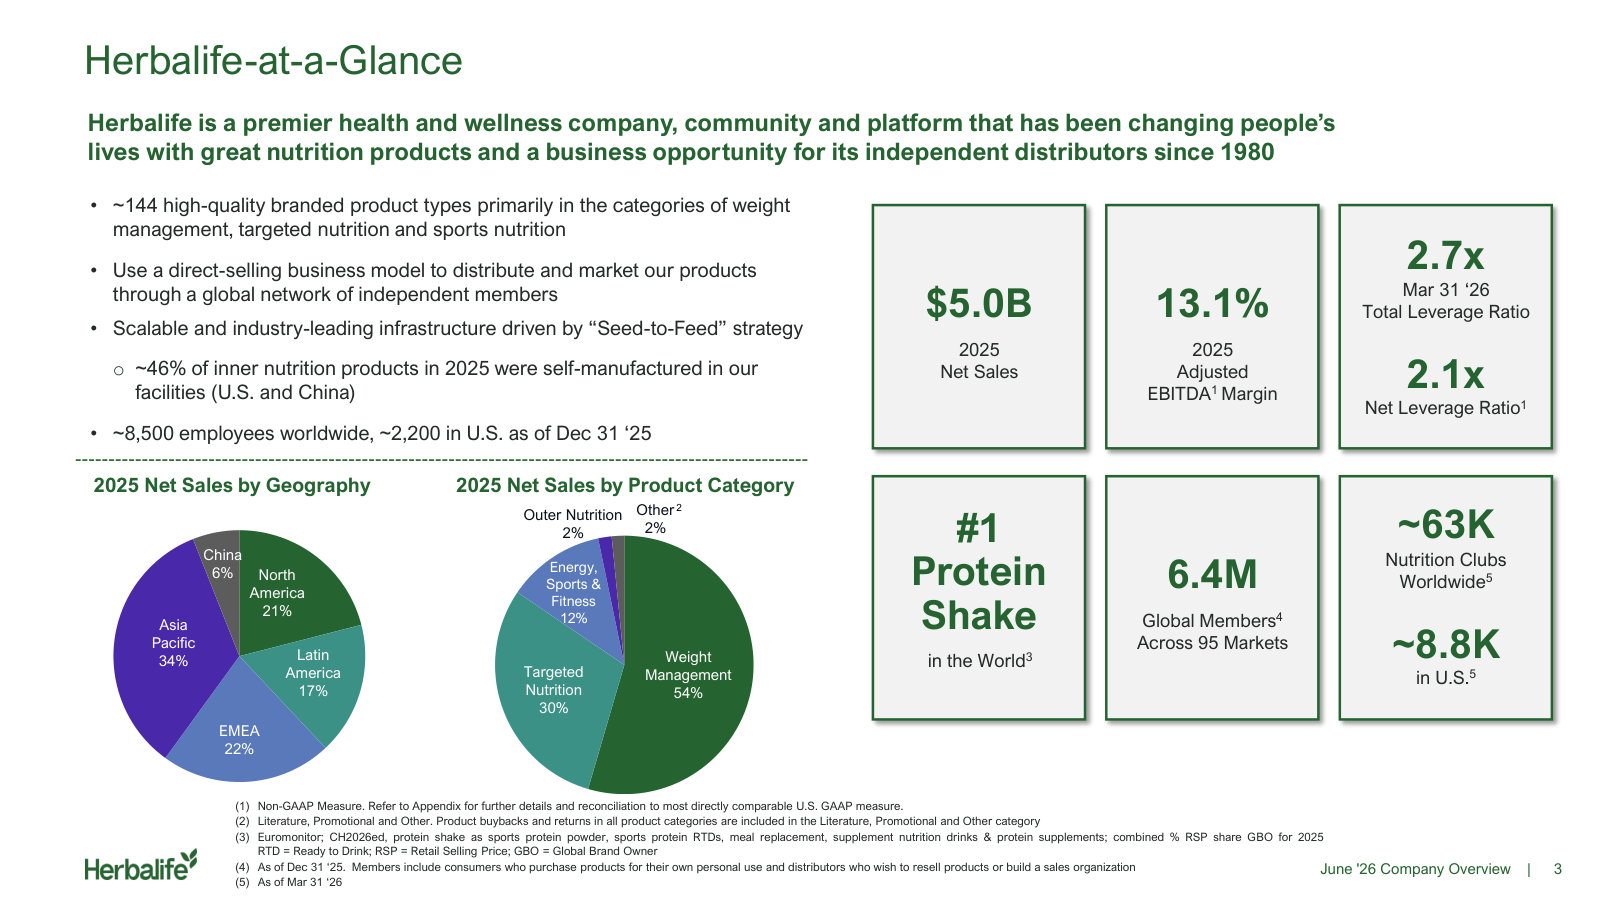
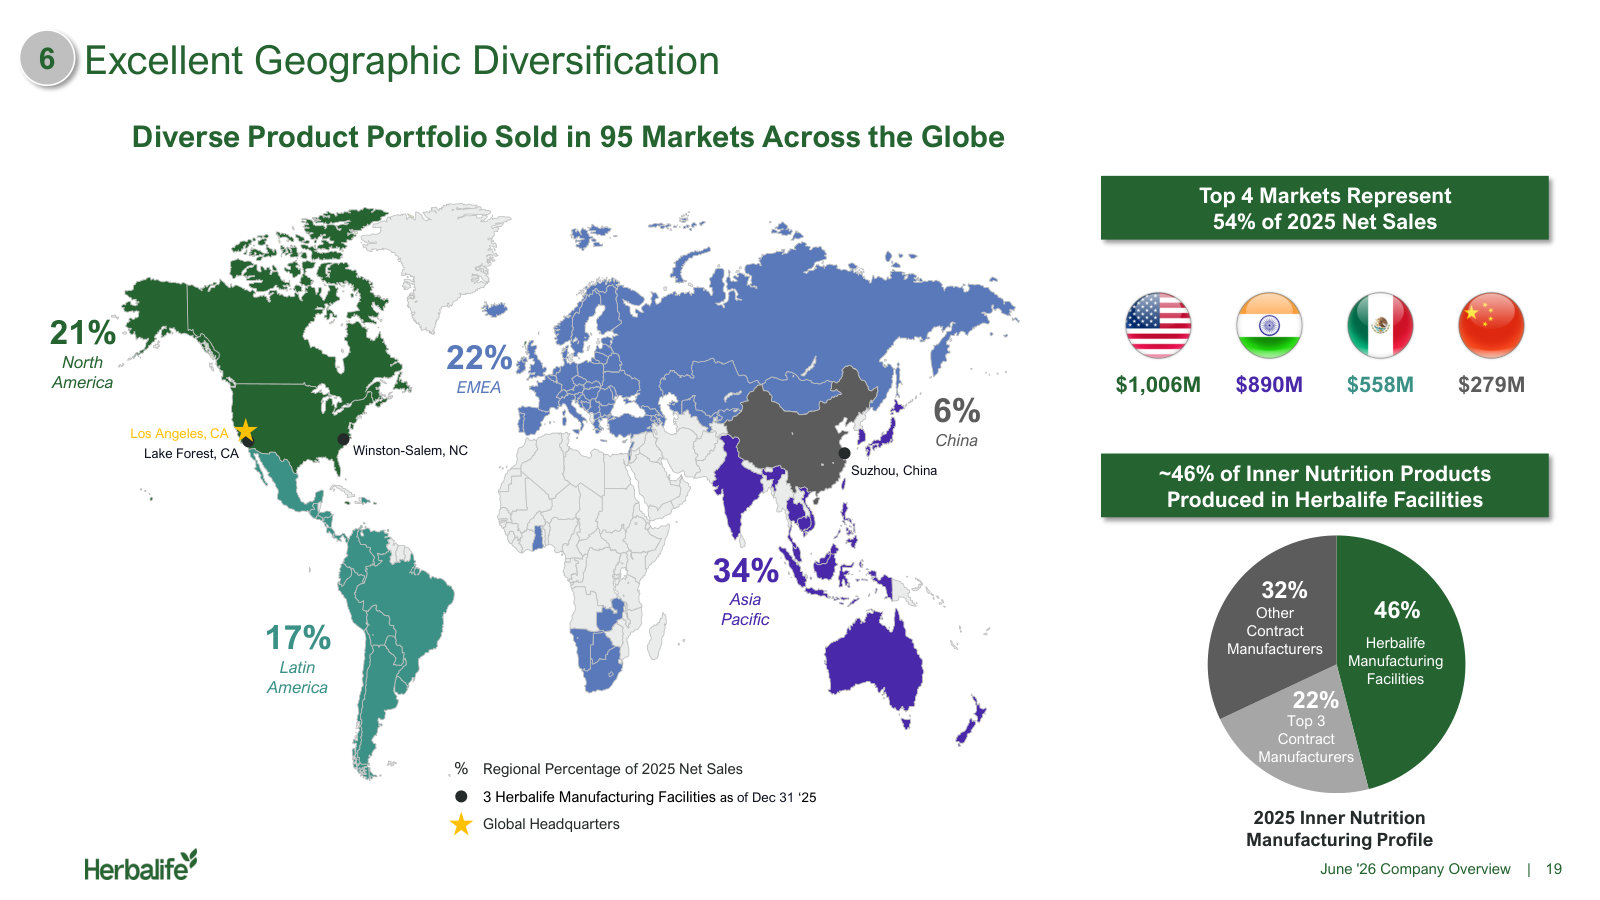
| North America | 1,429 | 1,262 | 1,131 | 1,054 | 1,033 |
| Latin America | 823 | 786 | 821 | 832 | 881 |
| EMEA | 1,335 | 1,078 | 1,069 | 1,085 | 1,114 |
| Asia Pacific | 1,586 | 1,687 | 1,714 | 1,724 | 1,730 |
| China | 630 | 391 | 327 | 298 | 279 |
| Worldwide | 5,803 | 5,204 | 5,062 | 4,993 | 5,038 |
Source: Form 10-K Item 7 MD&A, Sales by Geographic Region. Each 10-K prints two years; FY2021 is the comparative column of the FY2022 10-K. The five regions are Herbalife's operating segments (China is a separate reporting segment; the other four are aggregated into the Primary Reporting Segment). [3] [4] [5] [6]. Click any linked figure to open the filing page with the row highlighted.
Contribution Margin by Reporting Segment
| Contribution Margin by Reporting Segment | FY2021 | FY2022 | FY2023 | FY2024 | FY2025 |
|---|---|---|---|---|---|
| Primary Reporting Segment | 2,176 | 2,005 | 1,938 | 2,004 | 2,037 |
| China | — | 139 | 109 | 102 | 103 |
| Total contribution margin | — | 2,144 | 2,047 | 2,106 | 2,140 |
Source: Note 10, Segment Information. Contribution margin is net sales less cost of sales and selling expenses (member compensation, and service fees to China independent service providers). China was restated onto this basis from the FY2024 10-K onward, so FY2021 China and total contribution margin are not available on a comparable basis and are left blank; the Primary Reporting Segment measure is unchanged across all years. [7] [8] [9]. Click any linked figure to open the filing page with the row highlighted.
Income Statement
Source: Consolidated Statements of Income. FY2023-FY2025 as presented in the FY2025 10-K, which reclassified Royalty overrides into Selling expenses and split the former Selling, general, and administrative expenses line; FY2021-FY2022 as printed in the FY2022 10-K under the prior presentation. [1] [2]. Click any linked figure to open the filing page with the row highlighted.
Columns marked E are consensus analyst estimates from S&P Capital IQ (CapIQ), shown alongside reported results for direct comparison; they are not company guidance.
Estimate source: S&P Capital IQ (CapIQ) consensus, as of 2026-07-28. Estimate figures are S&P Capital IQ consensus (vendor data — no filing page links). EPS and net income use the normalized (adjusted) consensus where the street reports it. Line-item analyst models (segments, drivers, KPIs) are in the Visible Alpha tab.
Balance Sheet
Source: Consolidated Balance Sheets. Each 10-K prints two year-ends: FY2024-FY2025 from the FY2025 10-K, FY2022-FY2023 from the FY2023 10-K, FY2021 from the FY2021 10-K. [10] [11] [12]. Click any linked figure to open the filing page with the row highlighted.
Cash Flow
Source: Consolidated Statements of Cash Flows. FY2023-FY2025 from the FY2025 10-K, FY2021-FY2022 from the FY2022 10-K. [13] [14]. Click any linked figure to open the filing page with the row highlighted.
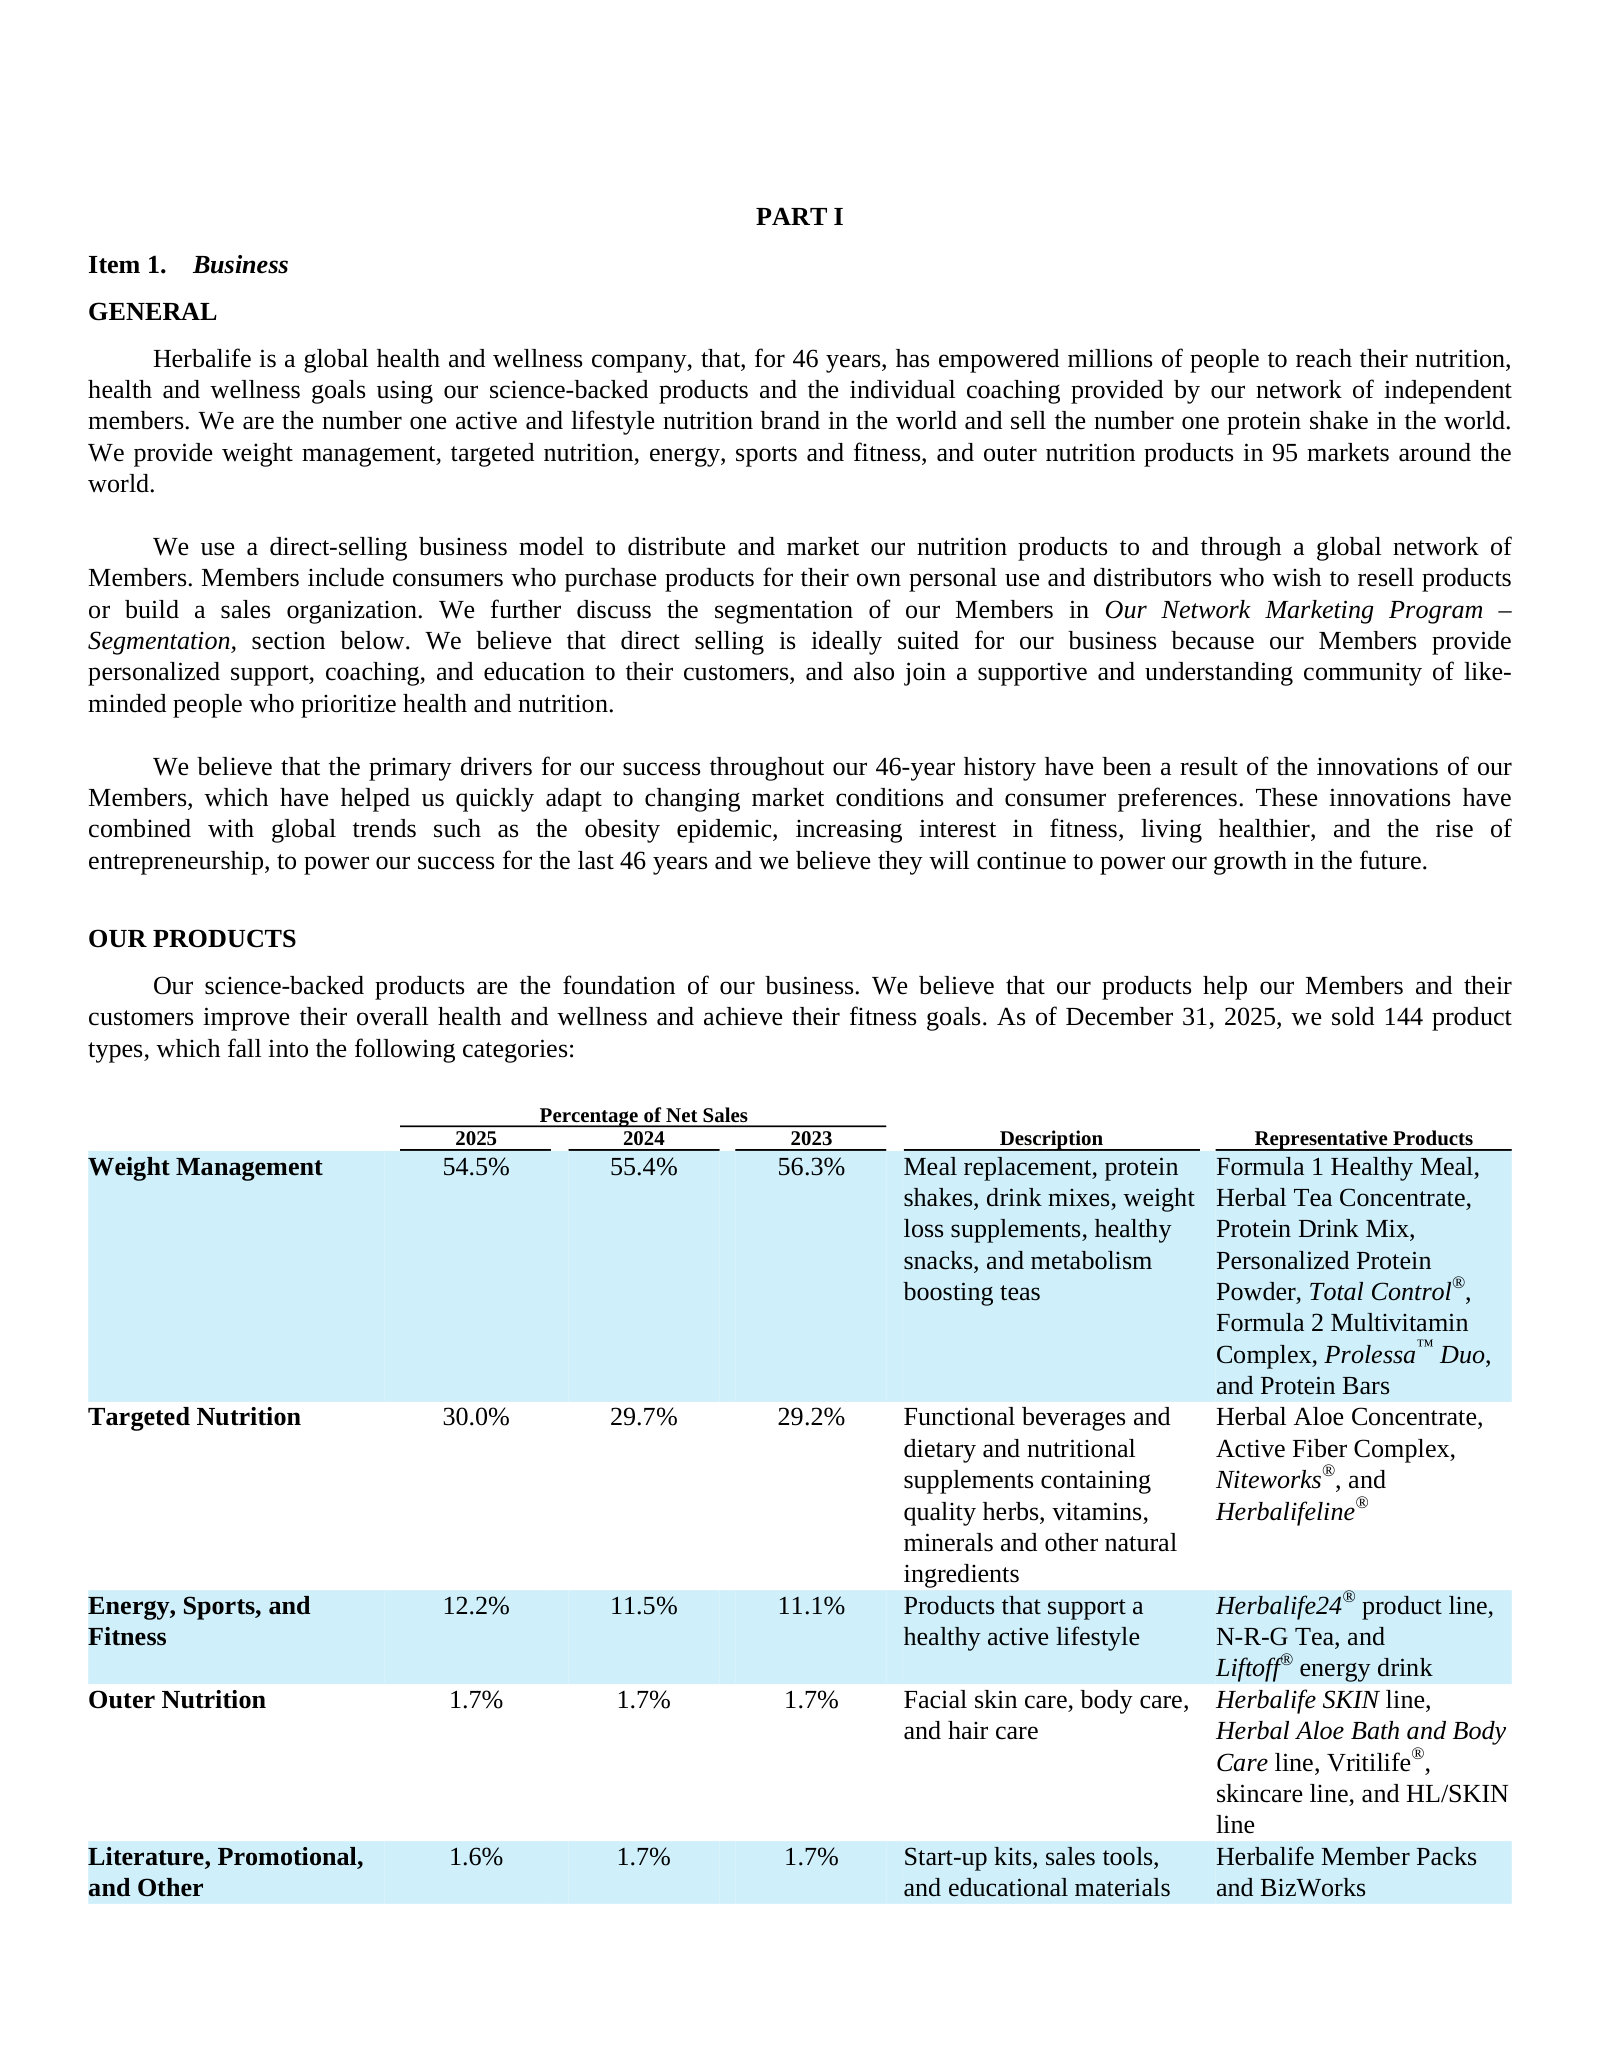
Net Sales by Product Line
| Net Sales by Product Line | FY2021 | FY2022 | FY2023 | FY2024 | FY2025 |
|---|---|---|---|---|---|
| Weight Management | 3,370 | 2,954 | 2,852 | 2,768 | 2,747 |
| Targeted Nutrition | 1,637 | 1,513 | 1,480 | 1,484 | 1,510 |
| Energy, Sports, and Fitness | 552 | 551 | 560 | 572 | 617 |
| Outer Nutrition | 108 | 86 | 82 | 84 | 85 |
| Literature, Promotional, and Other | 136 | 101 | 88 | 85 | 79 |
| Total net sales | 5,803 | 5,204 | 5,062 | 4,993 | 5,038 |
Source: Note 10, Segment Information. FY2023-FY2025 from the FY2025 10-K, FY2021-FY2022 from the FY2022 10-K. [7] [9]. Click any linked figure to open the filing page with the row highlighted.
Member Base and Workforce at December 31
| Member Base and Workforce at December 31 | FY2021 | FY2022 | FY2023 | FY2024 | FY2025 |
|---|---|---|---|---|---|
| Total Members (millions) | 6.3 | 6.2 | 6.5 | 6.2 | 6.4 |
| Preferred members (millions) | 2.5 | 2.9 | 3.5 | 3.0 | 3.1 |
| Distributors (millions) | 2.3 | 2.0 | 2.0 | 2.1 | 2.3 |
| Sales leaders at December 31, before February re-qualification | 793,000 | 772,000 | 760,000 | 733,000 | 750,000 |
| Employees | 10,800 | 10,100 | 9,200 | 8,600 | 8,500 |
Source: company filings [15] [16] [17] [18]. Click any linked figure to open the filing page with the row highlighted.
Sales Leaders by Region (end of February)
| Sales Leaders by Region (end of February) | FY2021 | FY2022 | FY2023 | FY2024 | FY2025 |
|---|---|---|---|---|---|
| North America | 95,402 | 80,278 | 69,586 | 58,782 | 52,939 |
| Latin America | 131,359 | 125,726 | 118,605 | 107,247 | 115,471 |
| EMEA | 158,153 | 183,056 | 170,202 | 162,424 | 154,482 |
| Asia Pacific | 173,582 | 201,137 | 223,714 | 242,792 | 257,725 |
| Total sales leaders (excluding China) | 558,496 | 590,197 | 582,107 | 571,245 | 580,617 |
Source: company filings [16] [19]. Click any linked figure to open the filing page with the row highlighted.
Sales Leader Retention Rate (annual re-qualification)
| Sales Leader Retention Rate (annual re-qualification) | FY2021 | FY2022 | FY2023 | FY2024 | FY2025 |
|---|---|---|---|---|---|
| North America | 70.8% | 58.8% | 69.7% | 70.3% | 75.4% |
| Latin America | 67.0% | 69.3% | 71.6% | 70.4% | 76.3% |
| EMEA | 72.7% | 77.1% | 64.6% | 66.9% | 65.6% |
| Asia Pacific | 63.5% | 66.5% | 66.6% | 67.4% | 68.8% |
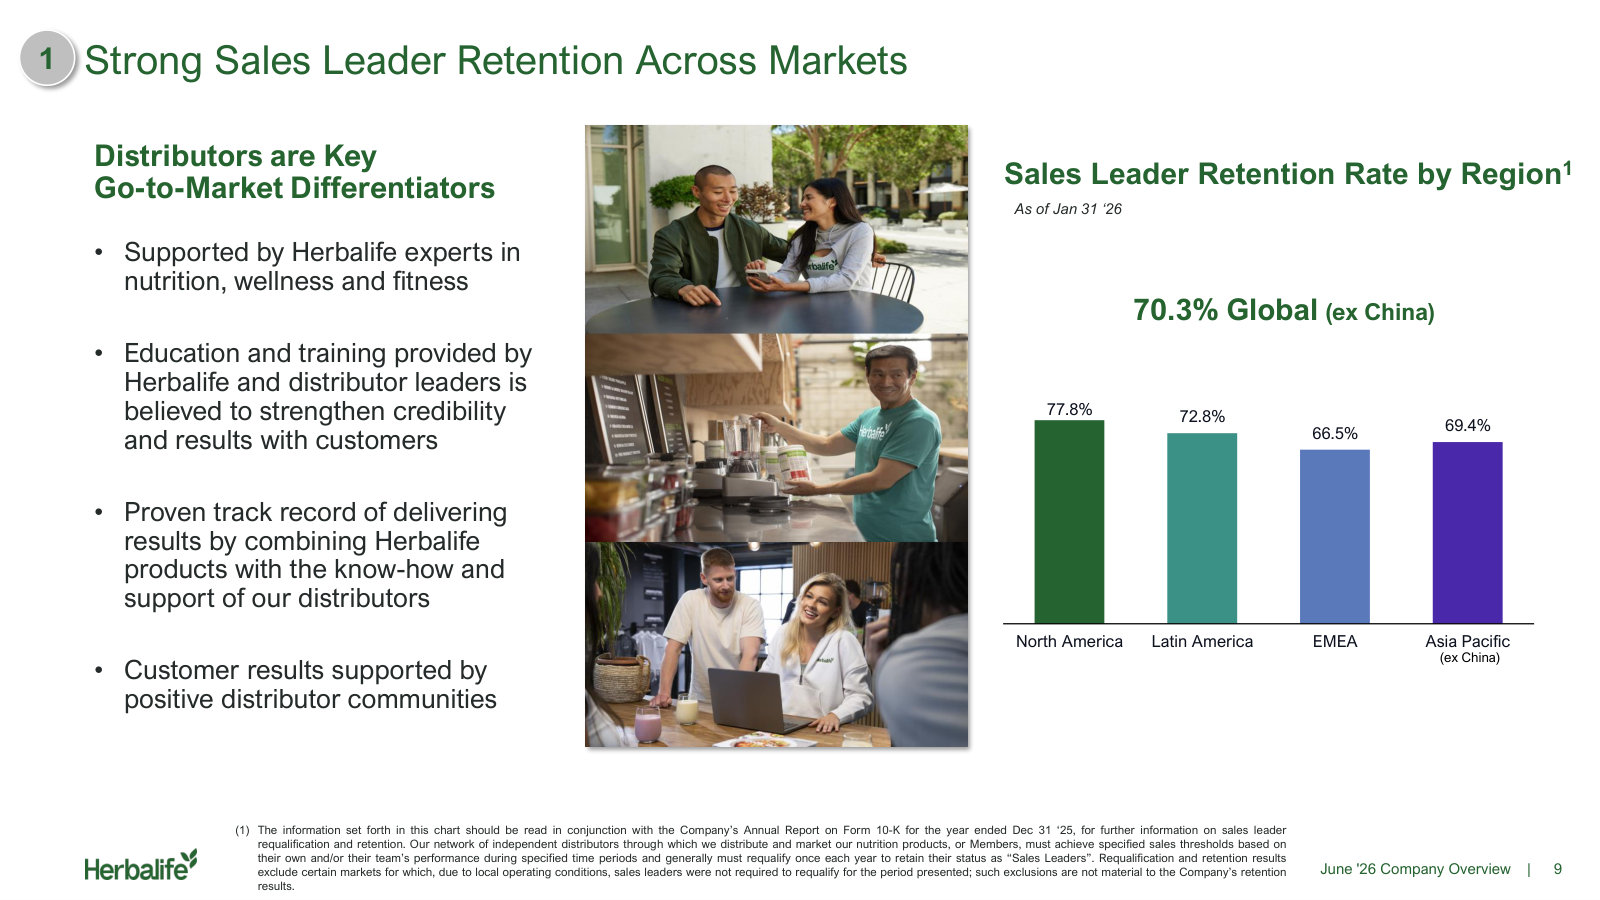
| Total sales leaders (excluding China) | 67.9% | 68.9% | 67.6% | 68.3% | 70.3% |
Source: company filings [20] [19]. Click any linked figure to open the filing page with the row highlighted.
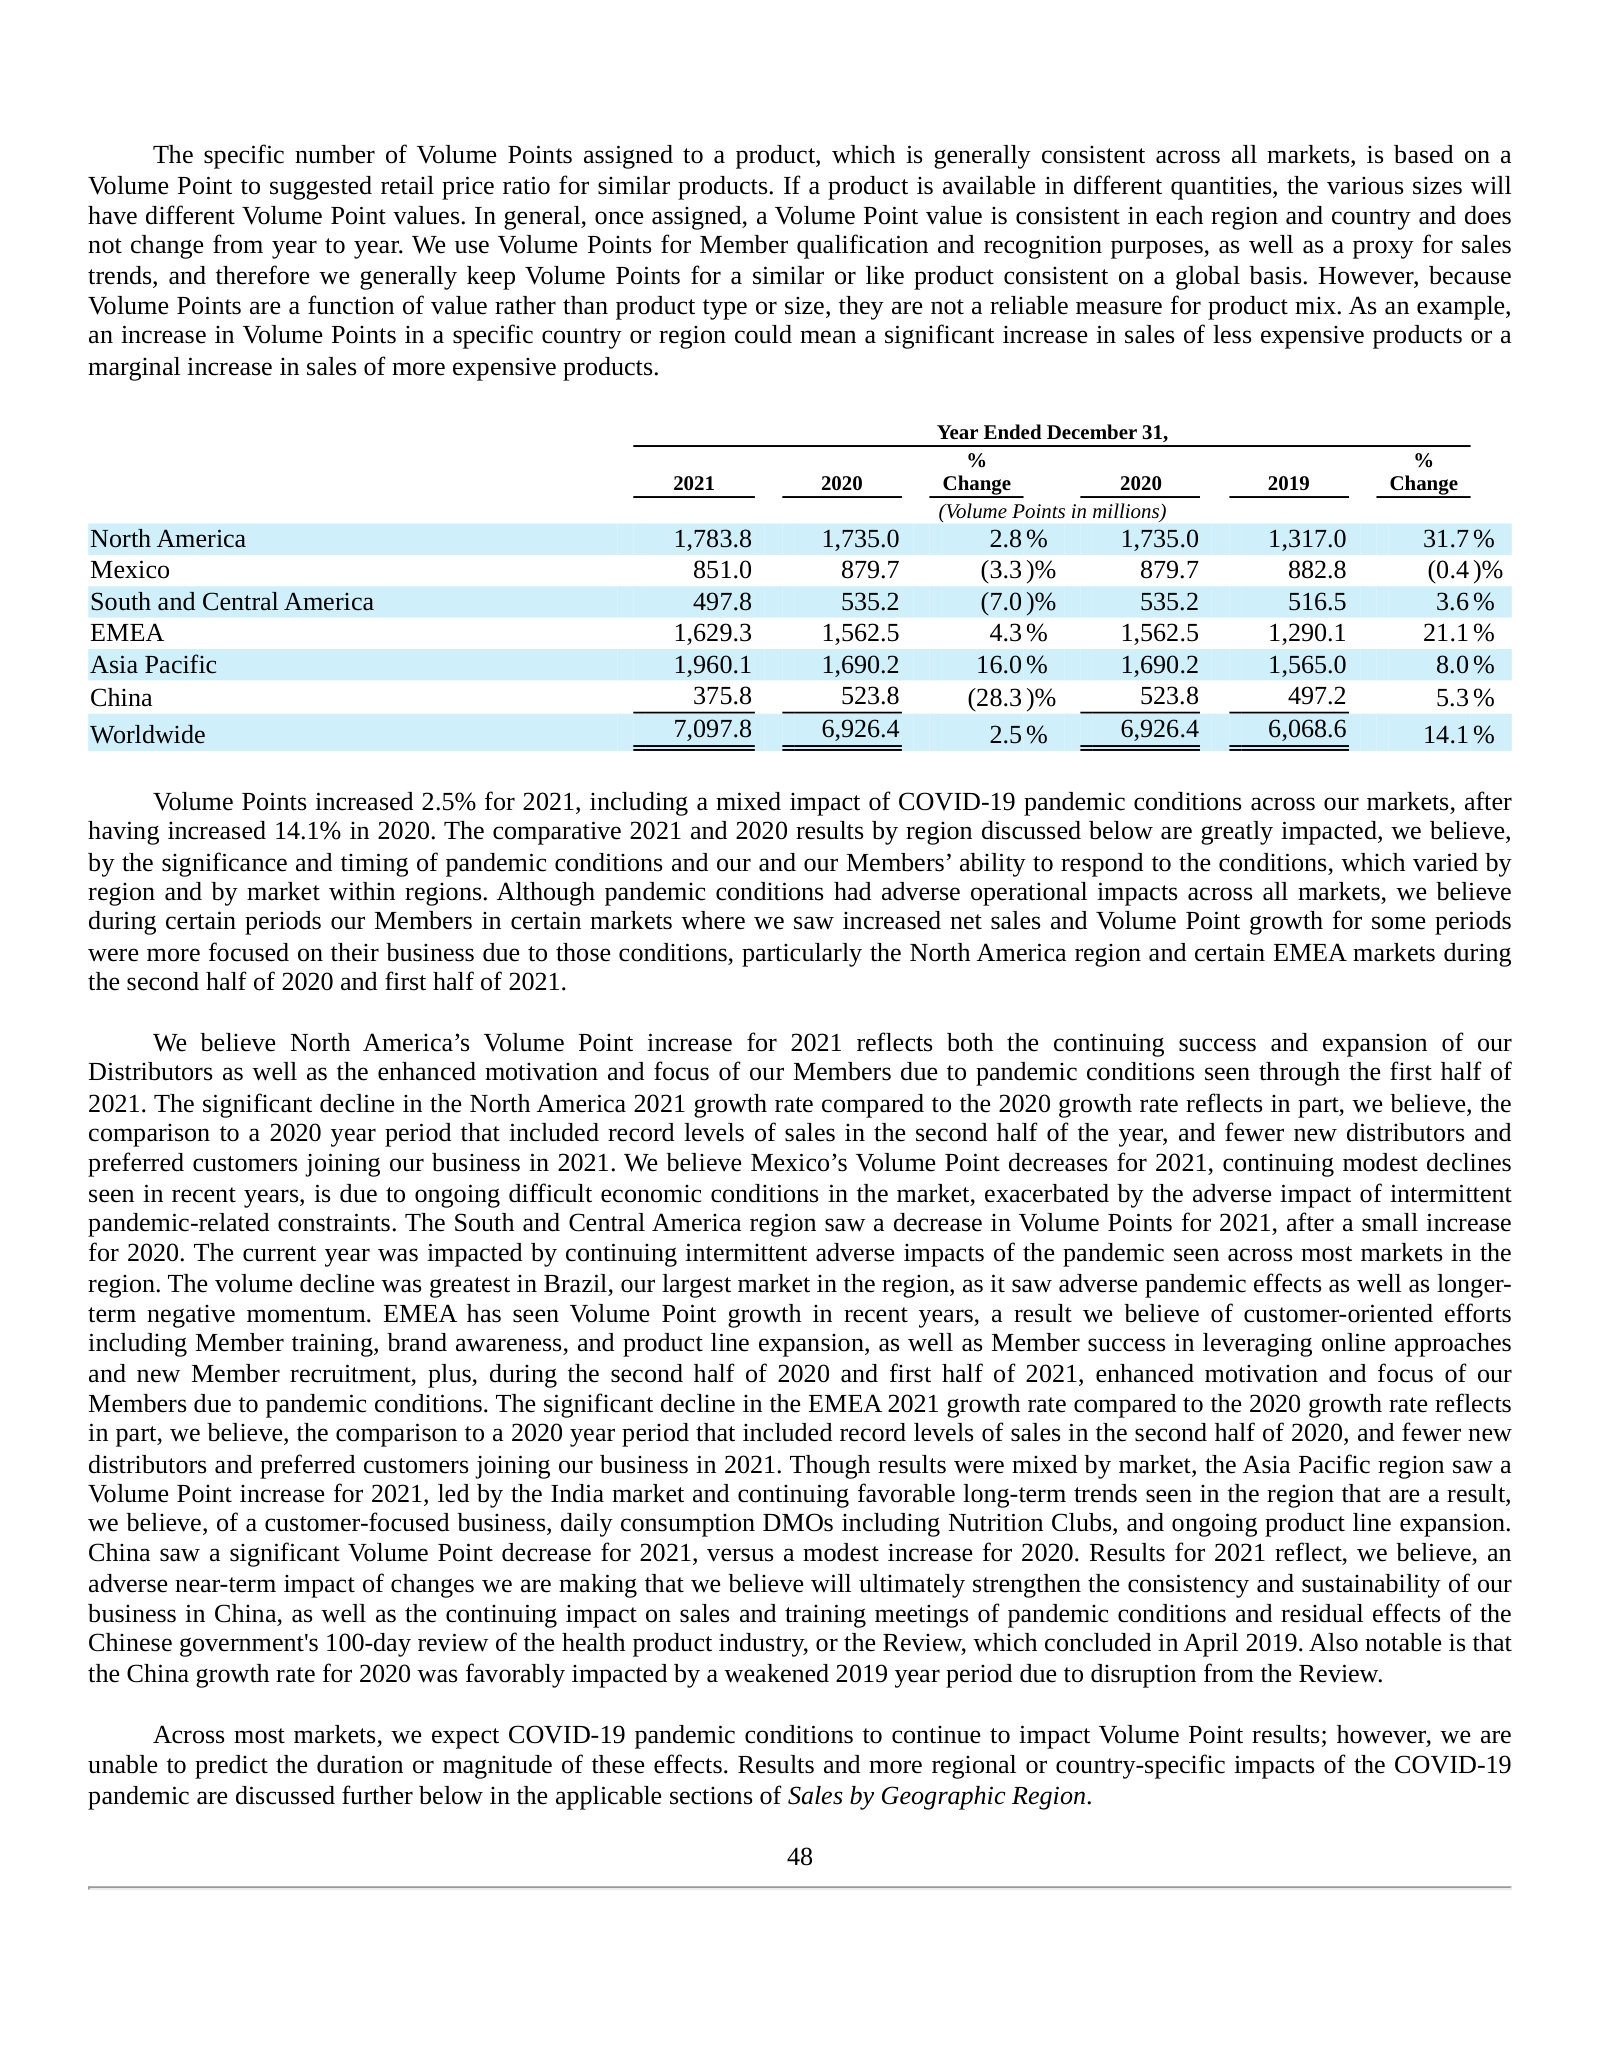
Volume Points by Geographic Region (millions)
| Volume Points by Geographic Region (millions) | FY2021 | FY2022 | FY2023 | FY2024 | FY2025 |
|---|---|---|---|---|---|
| North America | 1,783.8 | 1,430.2 | 1,160.9 | 1,029.5 | — |
| Latin America | 1,348.8 | 1,177.1 | 1,028.0 | 1,035.8 | — |
| EMEA | 1,629.3 | 1,353.4 | 1,222.9 | 1,136.2 | — |
| Asia Pacific | 1,960.1 | 2,156.5 | 2,151.5 | 2,145.3 | — |
| China | 375.8 | 261.4 | 237.6 | 222.1 | — |
| Worldwide | 7,097.8 | 6,378.6 | 5,800.9 | 5,568.9 | — |
Source: company filings [21] [22]. Click any linked figure to open the filing page with the row highlighted.
Net Sales Drivers (year-over-year)
| Net Sales Drivers (year-over-year) | FY2021 | FY2022 | FY2023 | FY2024 | FY2025 |
|---|---|---|---|---|---|
| Net sales change in local currency | 3.3% | (5.4%) | (1.6%) | 1.2% | 2.5% |
| Impact of price increases on net sales | 2.9% | 7.9% | 8.5% | 5.3% | 3.2% |
| Impact of foreign currency fluctuations on net sales | 1.4% | (4.9%) | (1.1%) | (2.6%) | (1.6%) |
| Change in sales volume | 2.5% | (10.1%) | (9.1%) | (4.0%) | (0.5%) |
Source: company filings [23] [24] [25] [26]. Click any linked figure to open the filing page with the row highlighted.
Long-Term Record
| Fiscal year | Net sales | Operating income | Net income | Diluted earnings per share | Net cash provided by operating activities | Purchases of property, plant, and equipment |
|---|---|---|---|---|---|---|
| FY2016 | 4,488 | 458 | 260 | 1.51 | 367 | (143) |
| FY2017 | 4,428 | 617 | 214 | 1.29 | 591 | (96) |
| FY2018 | 4,892 | 683 | 297 | 1.98 | 648 | (84) |
| FY2019 | 4,877 | 568 | 311 | 2.20 | 458 | (106) |
| FY2020 | 5,542 | 641 | 373 | 2.77 | 629 | (112) |
| FY2021 | 5,803 | 734 | 447 | 4.13 | 460 | (151) |
| FY2022 | 5,204 | 545 | 321 | 3.23 | 352 | (156) |
| FY2023 | 5,062 | 356 | 142 | 1.42 | 358 | (135) |
| FY2024 | 4,993 | 386 | 254 | 2.50 | 285 | (122) |
| FY2025 | 5,038 | 481 | 228 | 2.20 | 333 | (80) |
Source: consolidated statements across filings; older years from the standardized feed [13] [1] [14] [2]. Click any linked figure to open the filing page with the row highlighted.
Operating KPIs
| KPI | FY2021 | FY2022 | FY2023 | FY2024 | FY2025 |
|---|---|---|---|---|---|
| Worldwide total sales leaders (end of February) | 626,797 | 623,683 | 620,424 | 594,039 | 602,708 |
| Sales leaders in China (end of February) | 68,301 | 33,486 | 38,317 | 22,794 | 22,091 |
Source: company-reported operating metrics [16] [19]. Click any linked figure to open the filing page with the row highlighted.
Analyst Consensus
Mean target
Median target
High target
Low target
Street ratings: 2 strong buy, 1 buy, 1 sell. Consensus: Buy.
Estimate source: S&P Capital IQ (CapIQ) consensus, as of 2026-07-28. Estimate figures are S&P Capital IQ consensus (vendor data — no filing page links). EPS and net income use the normalized (adjusted) consensus where the street reports it. Line-item analyst models (segments, drivers, KPIs) are in the Visible Alpha tab.
Traceability
524 of 542 figures on this page (97%) link to the filing page where they are printed — click a linked figure to open the source PDF at that page with the row highlighted. Unlinked figures come from standardized data feeds or pre-filing years.
Revenue is disaggregated three ways because Herbalife reports and discusses all three: by geographic region (the hero cut, and the basis of its operating segments), by product line, and by reporting segment (Primary Reporting Segment versus China).
In the FY2025 10-K Herbalife renamed Royalty overrides to member compensation and re-cut its operating expenses into Selling expenses and General and administrative expenses; FY2023 and FY2024 were revised onto that basis. FY2021 and FY2022 are shown on the prior Royalty overrides / Selling, general, and administrative expenses basis exactly as printed in the FY2022 10-K, on their own rows. Total operating expense is unaffected by the reclassification.
FY2016-FY2018 rows of the Long-Term Record come from the standardized SEC XBRL data feed and carry no page links. FY2019 and FY2020 are comparative columns of the FY2021 10-K and are linked.
Net income for FY2025 is the consolidated 227.8 as printed; net income attributable to Herbalife was 228.3, and diluted EPS of 2.20 is computed on the attributable figure.
Volume Points by geographic region, historically Herbalife's headline volume KPI, was discontinued in the FY2025 10-K, so the KPI block uses the number of sales leaders (measured at the end of February following each year's re-qualification, as the filings define it).
The quarterly block covers Q1 FY2025 through Q1 FY2026 from the Forms 10-Q. Q4 FY2025 is absent: US registrants file no fourth-quarter 10-Q, and the corpus's Q4 FY2025 Form 8-K contains only the cover page, not the earnings release exhibit with printed statements.
Quarterly cash-flow figures for Q2 FY25 and Q3 FY25 are differences of consecutive printed year-to-date statements; each reconciles exactly to the SEC XBRL quarterly cash-flow feed.
4 figure(s) differed between the data feed and the filing; the filing value is shown (see the run's metrics/metrics_tab.json for the audit trail).
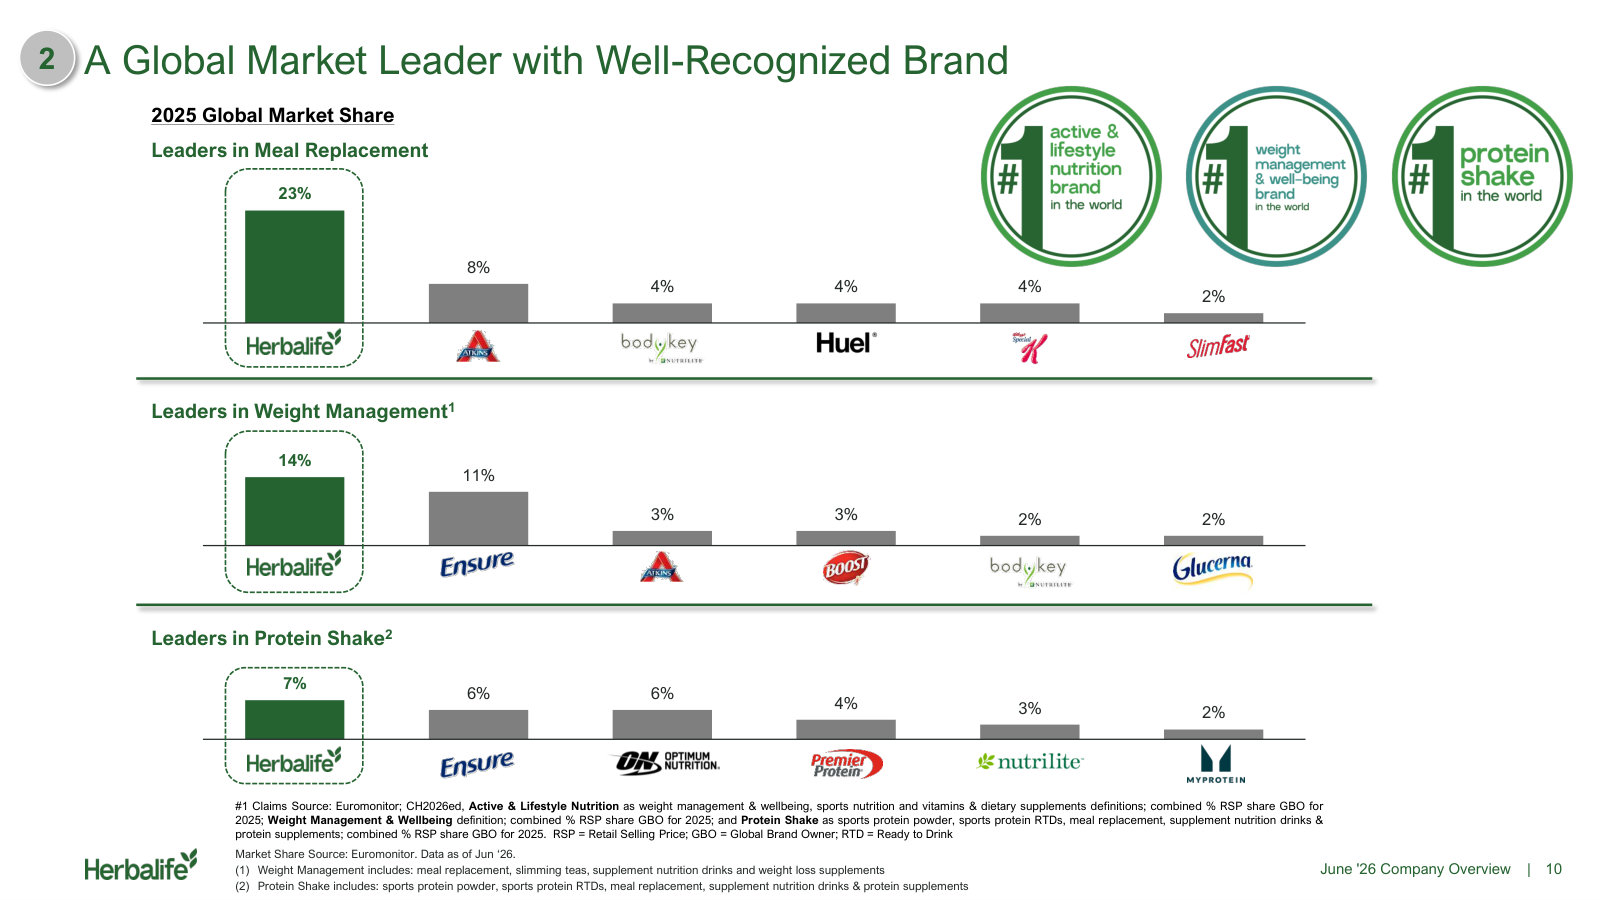
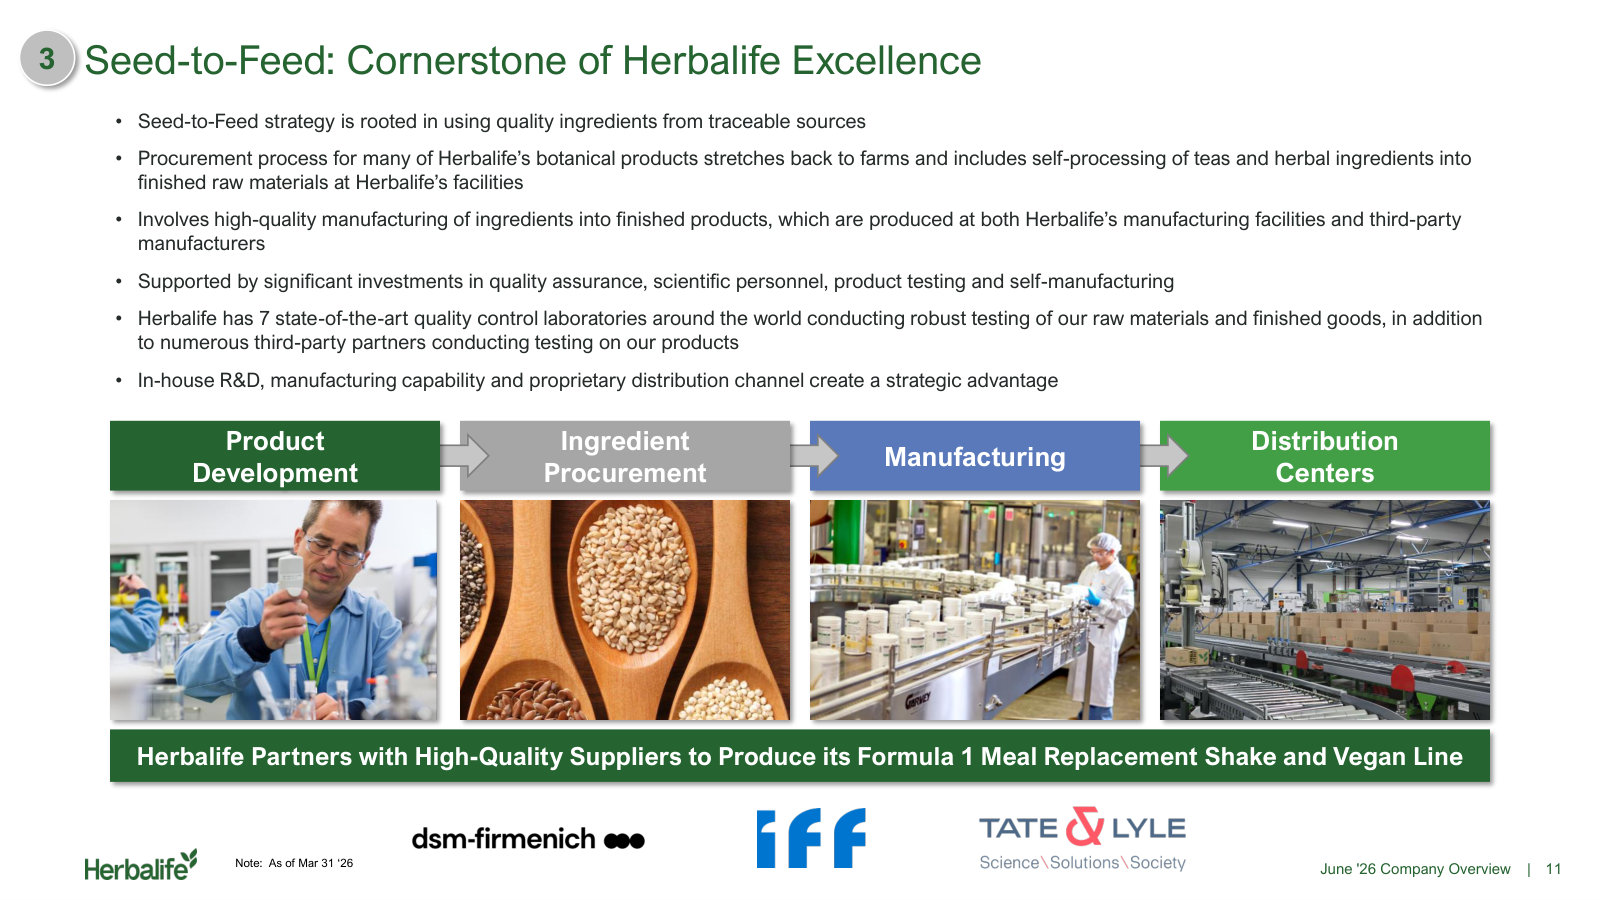
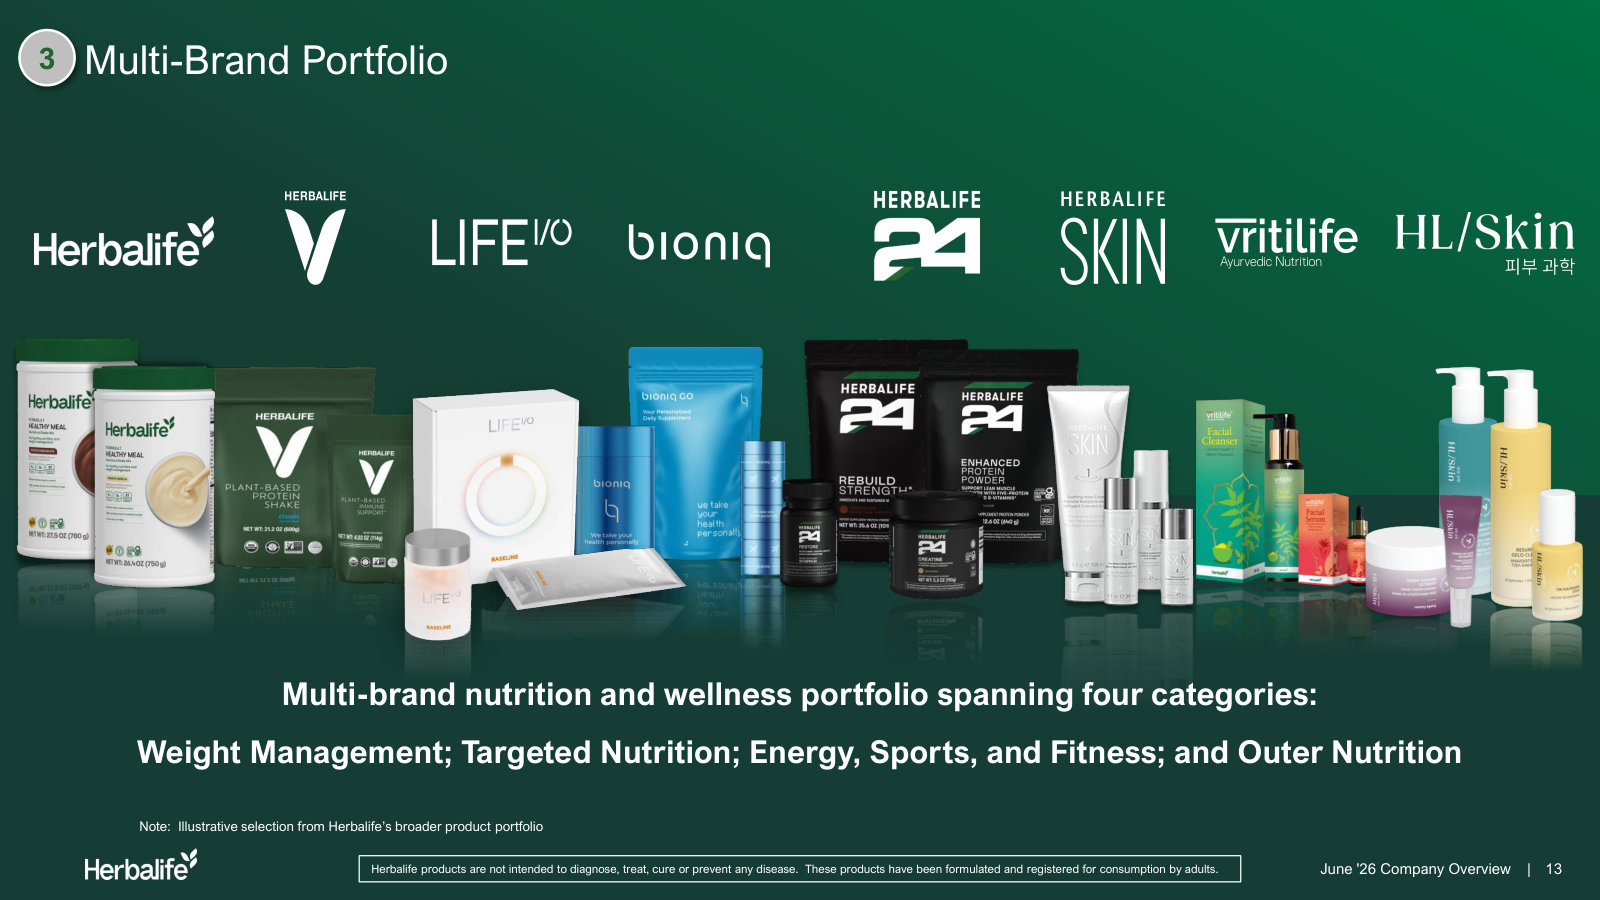
Herbalife Ltd.'s management explains the business in its own materials. The slides below do the most of that work, pulled from the documents preserved in Sources. Each source link opens the complete presentation at that slide in a new tab.
Company Overview — June 2026
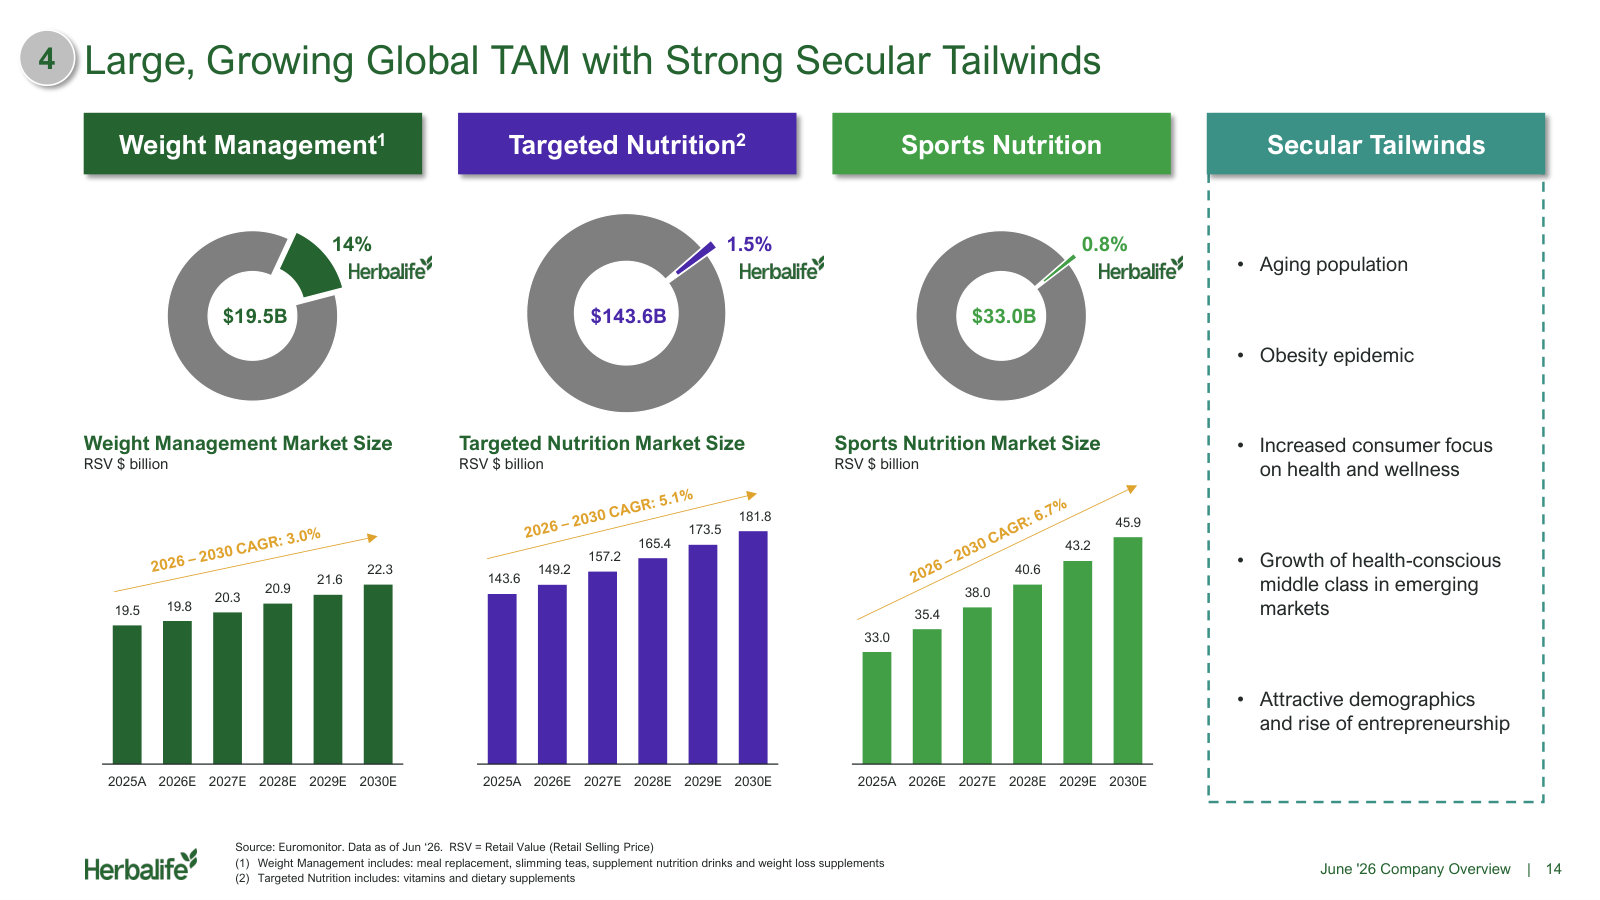
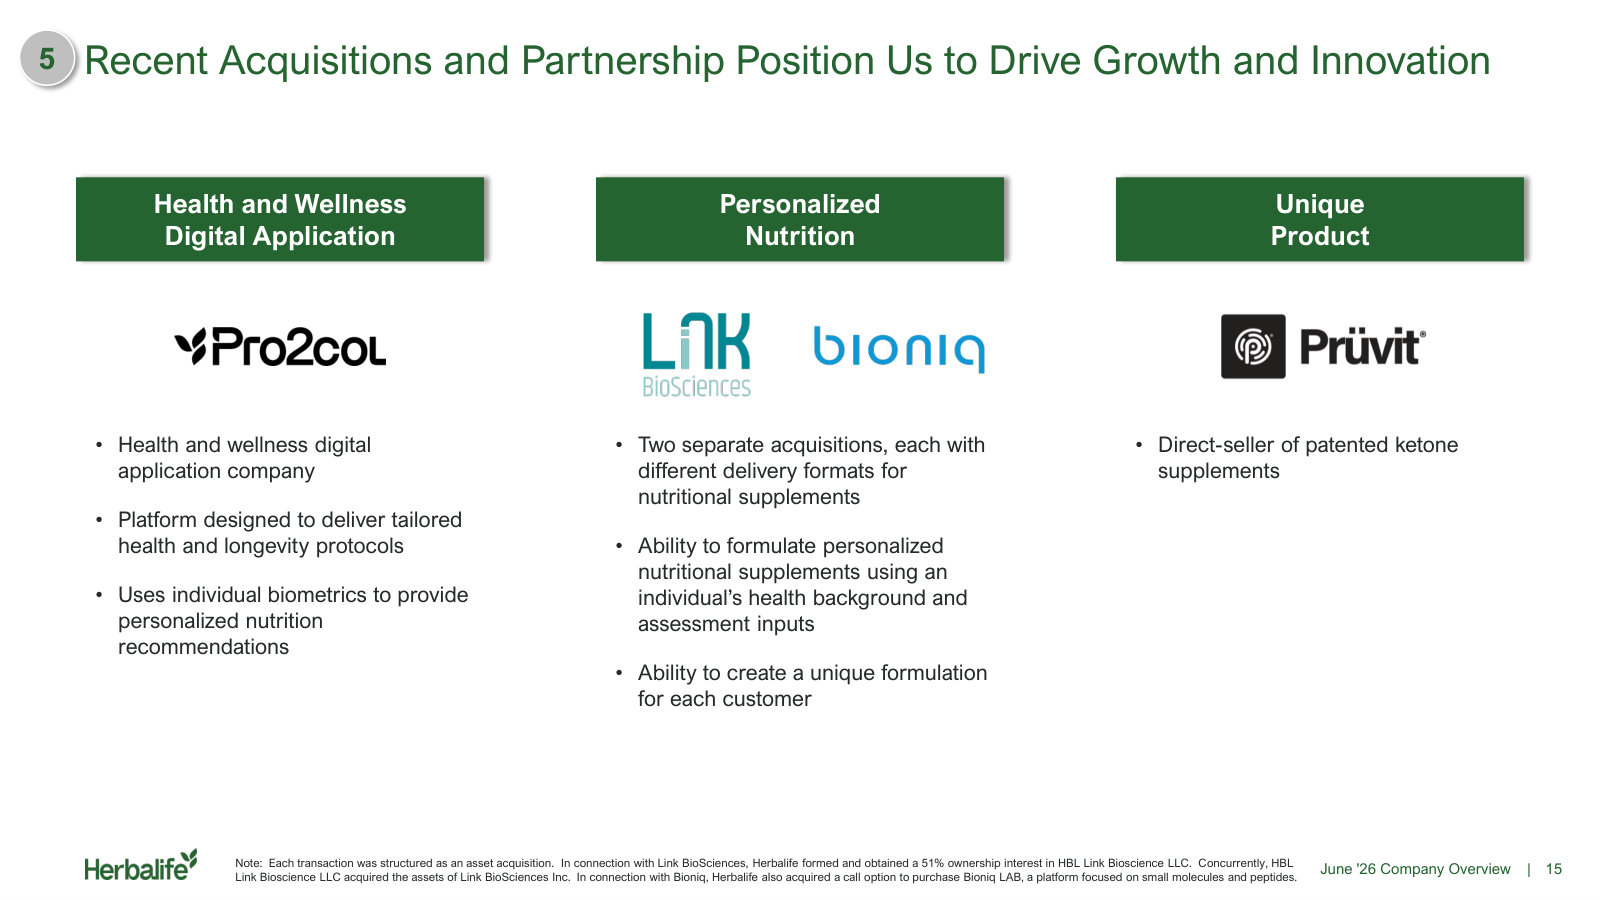
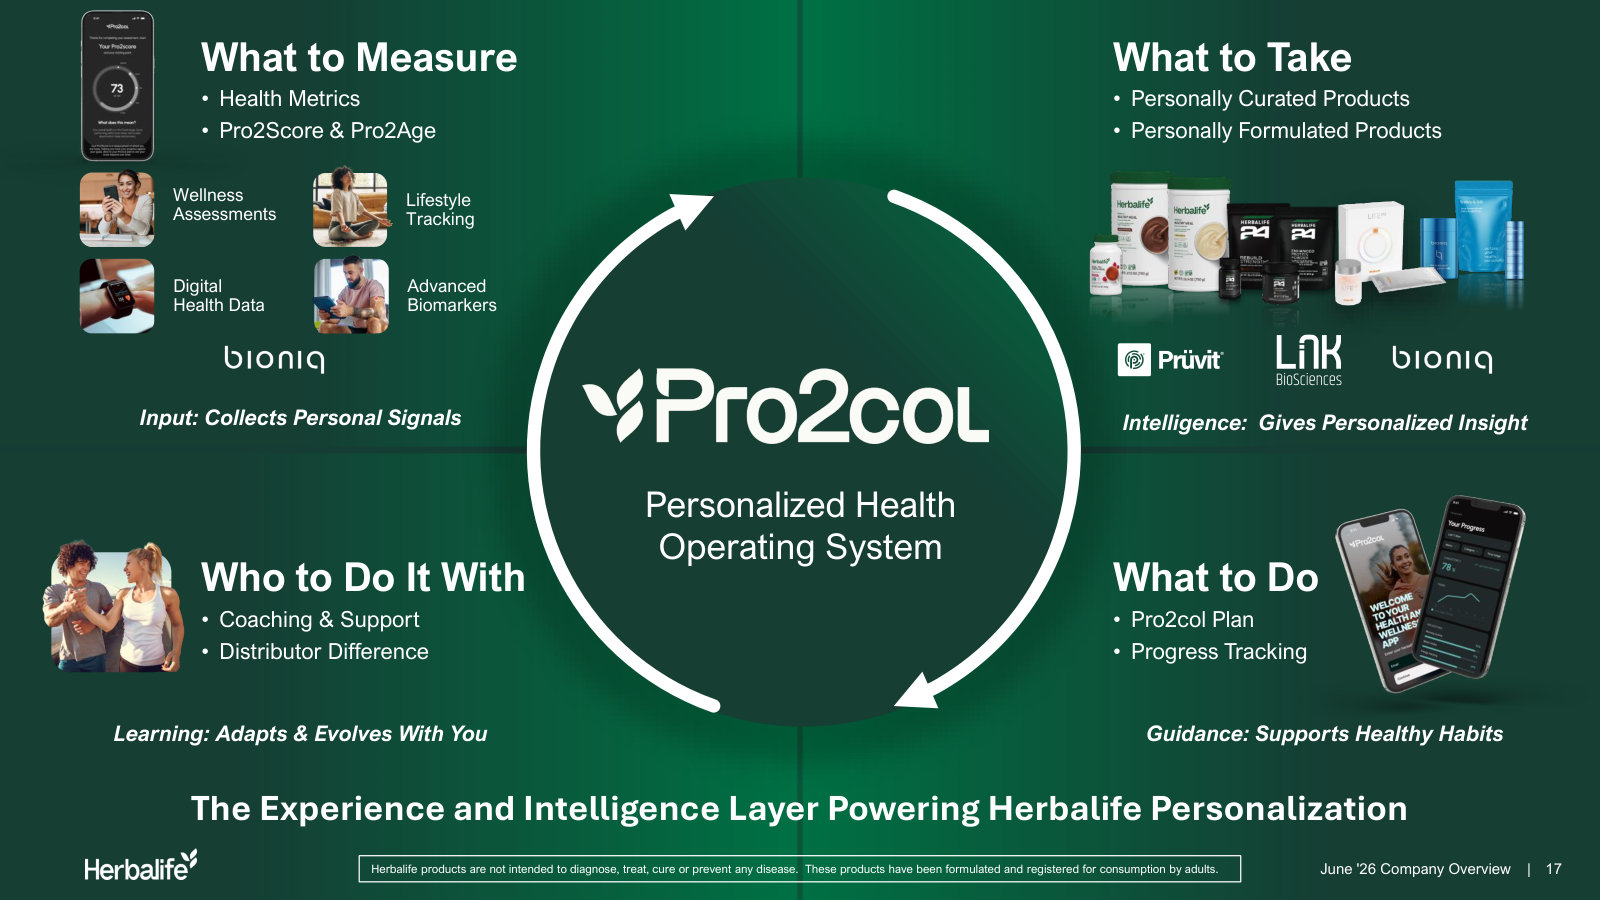
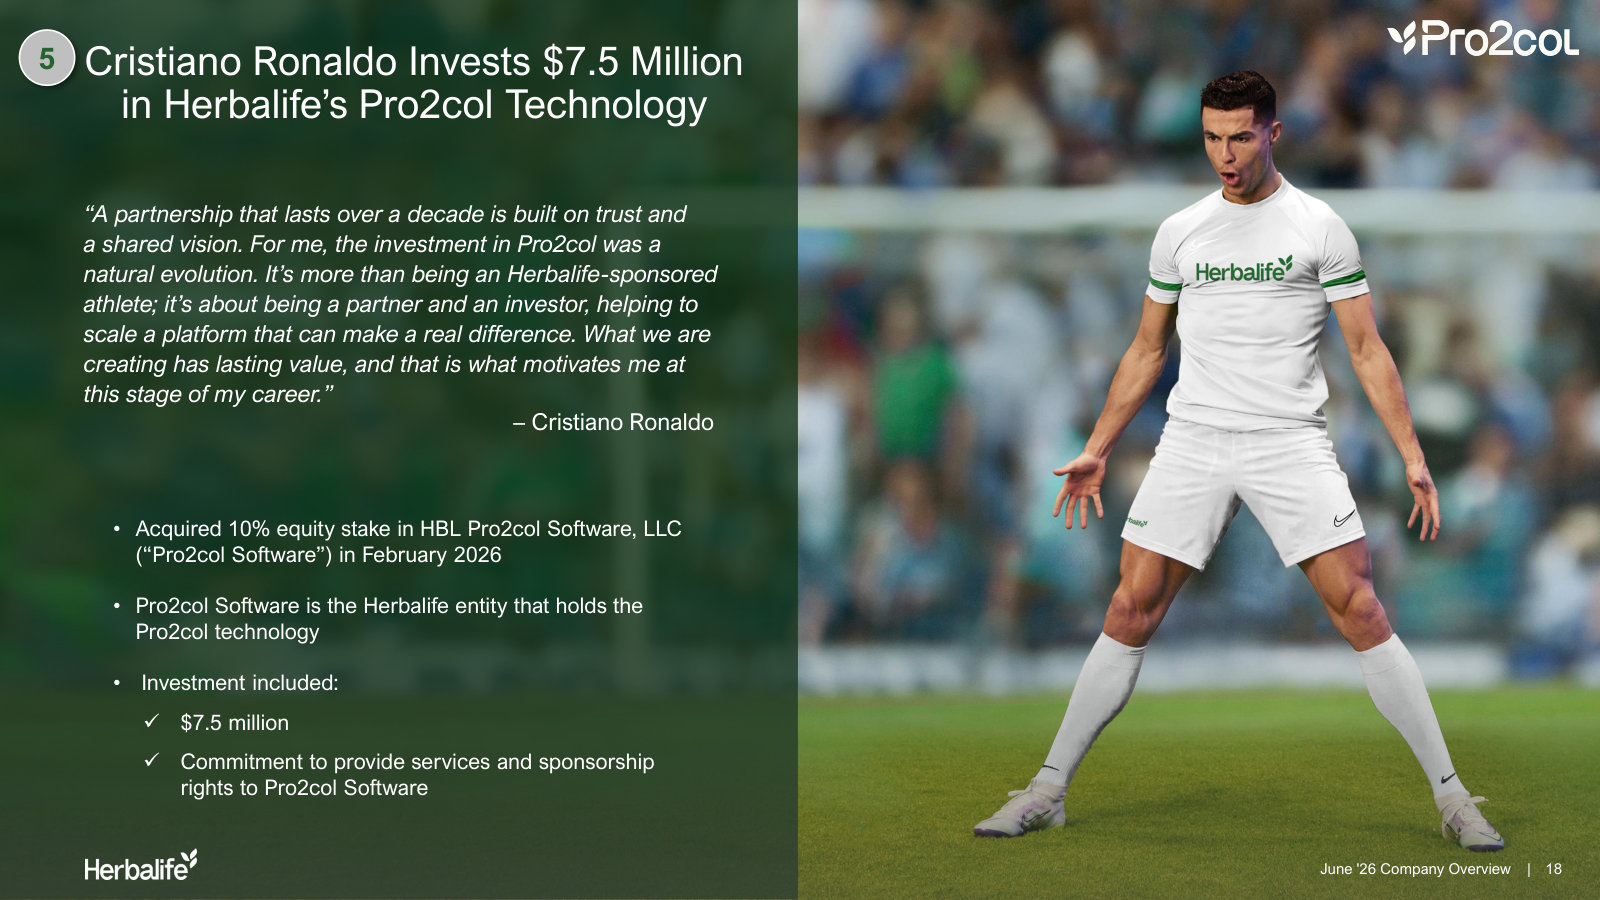
Management's own zero-to-one explainer: business model, distribution channel, market position, brand portfolio and five-year financials. · Open the full document →
Q1 2026 Earnings Presentation — Q1 2026
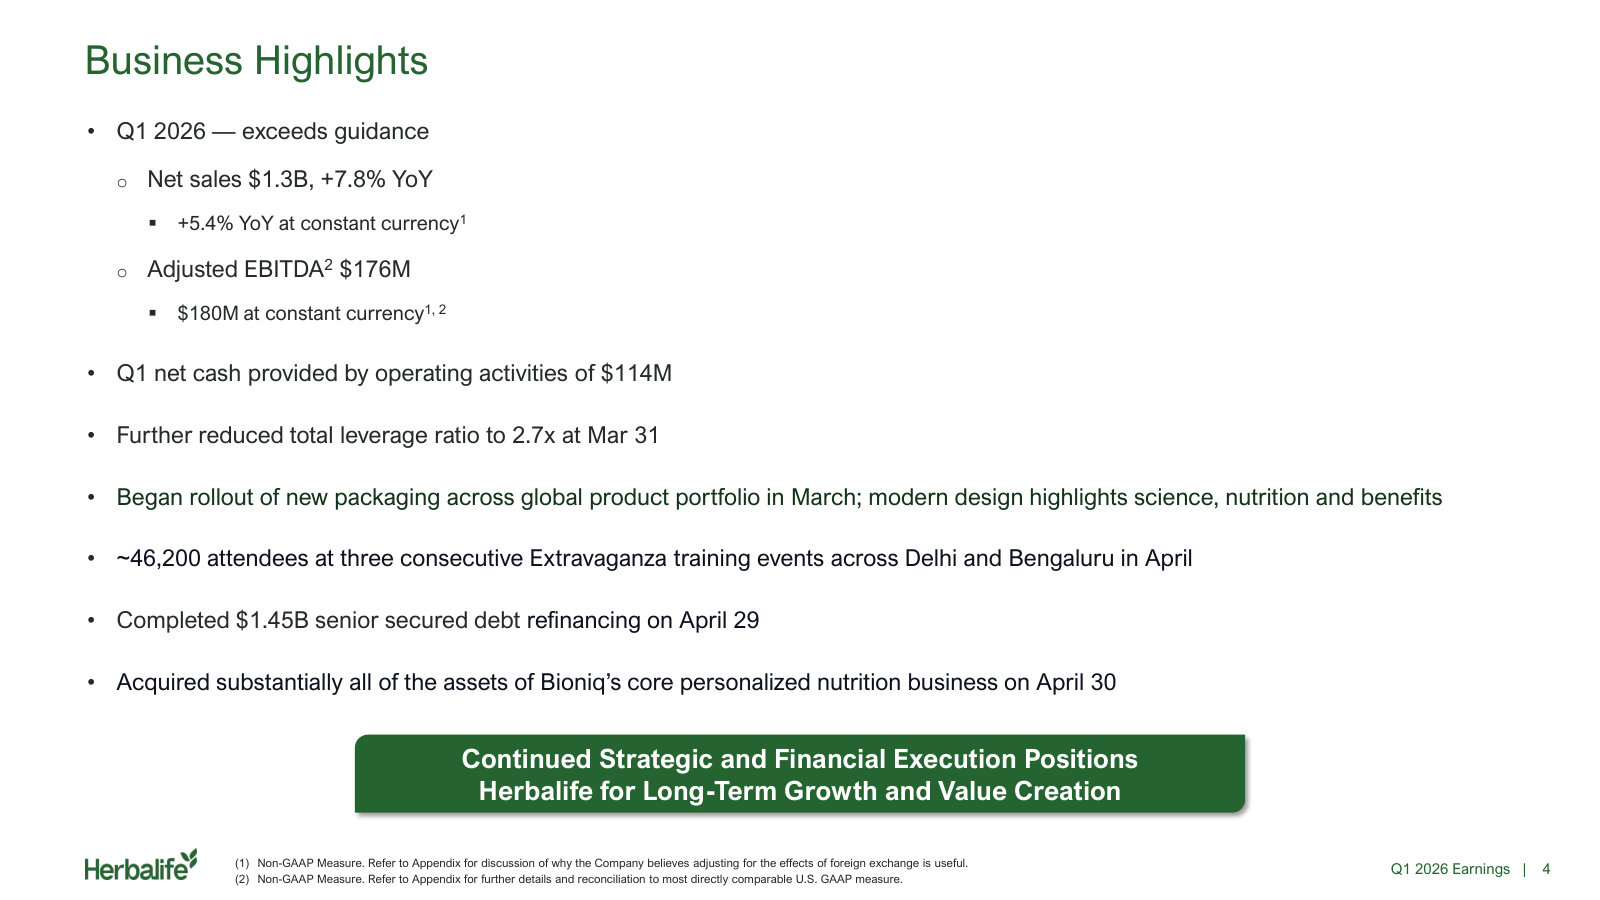
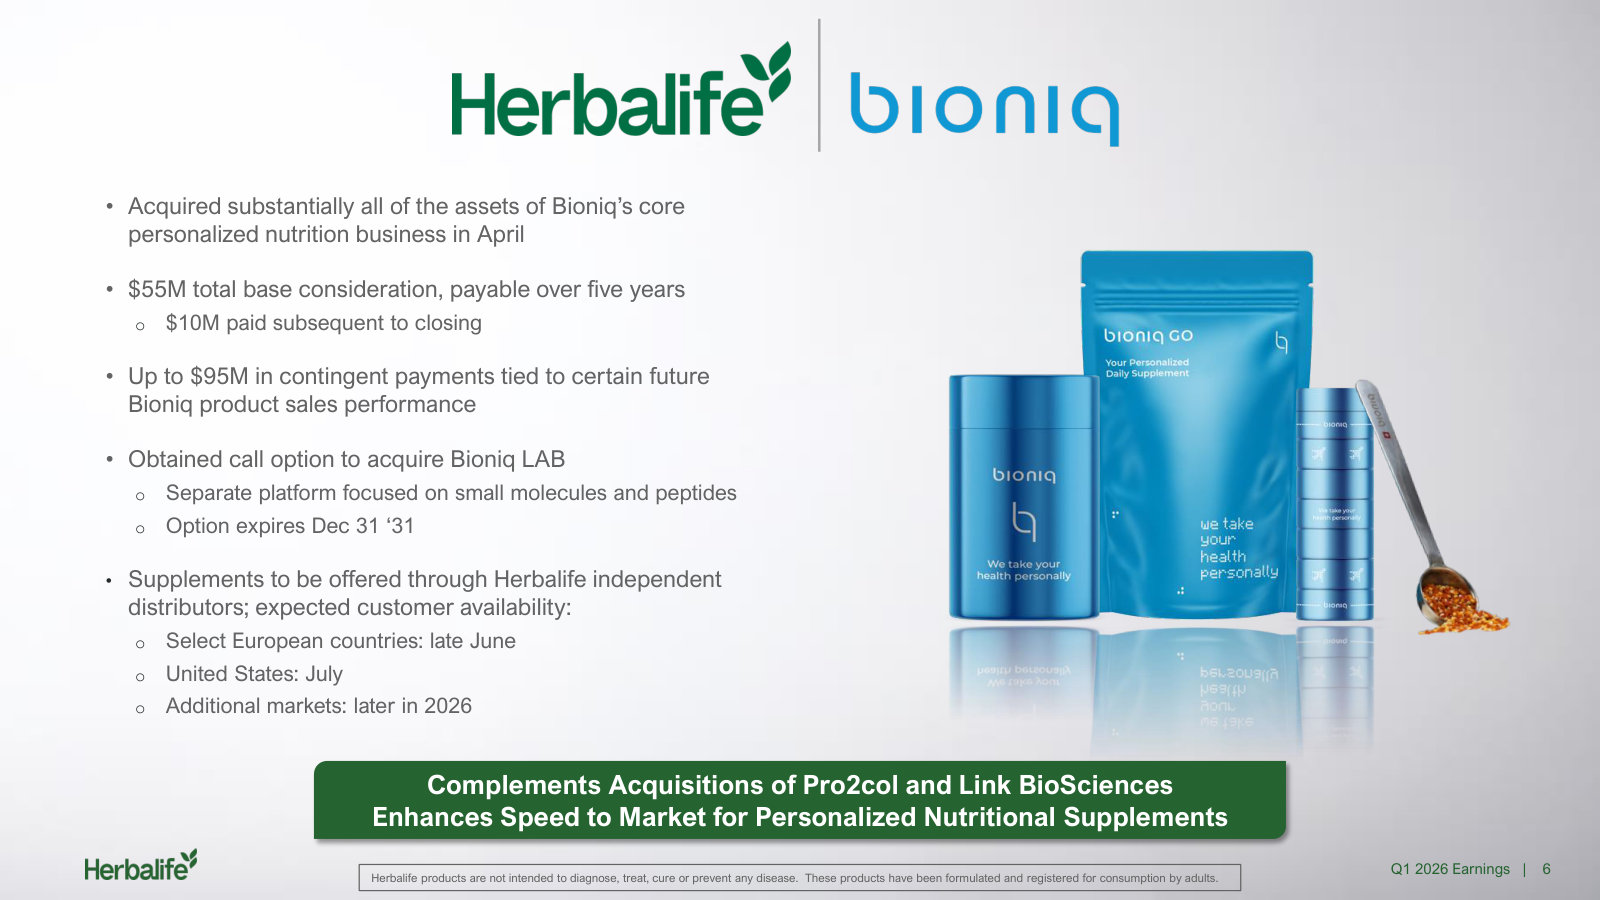
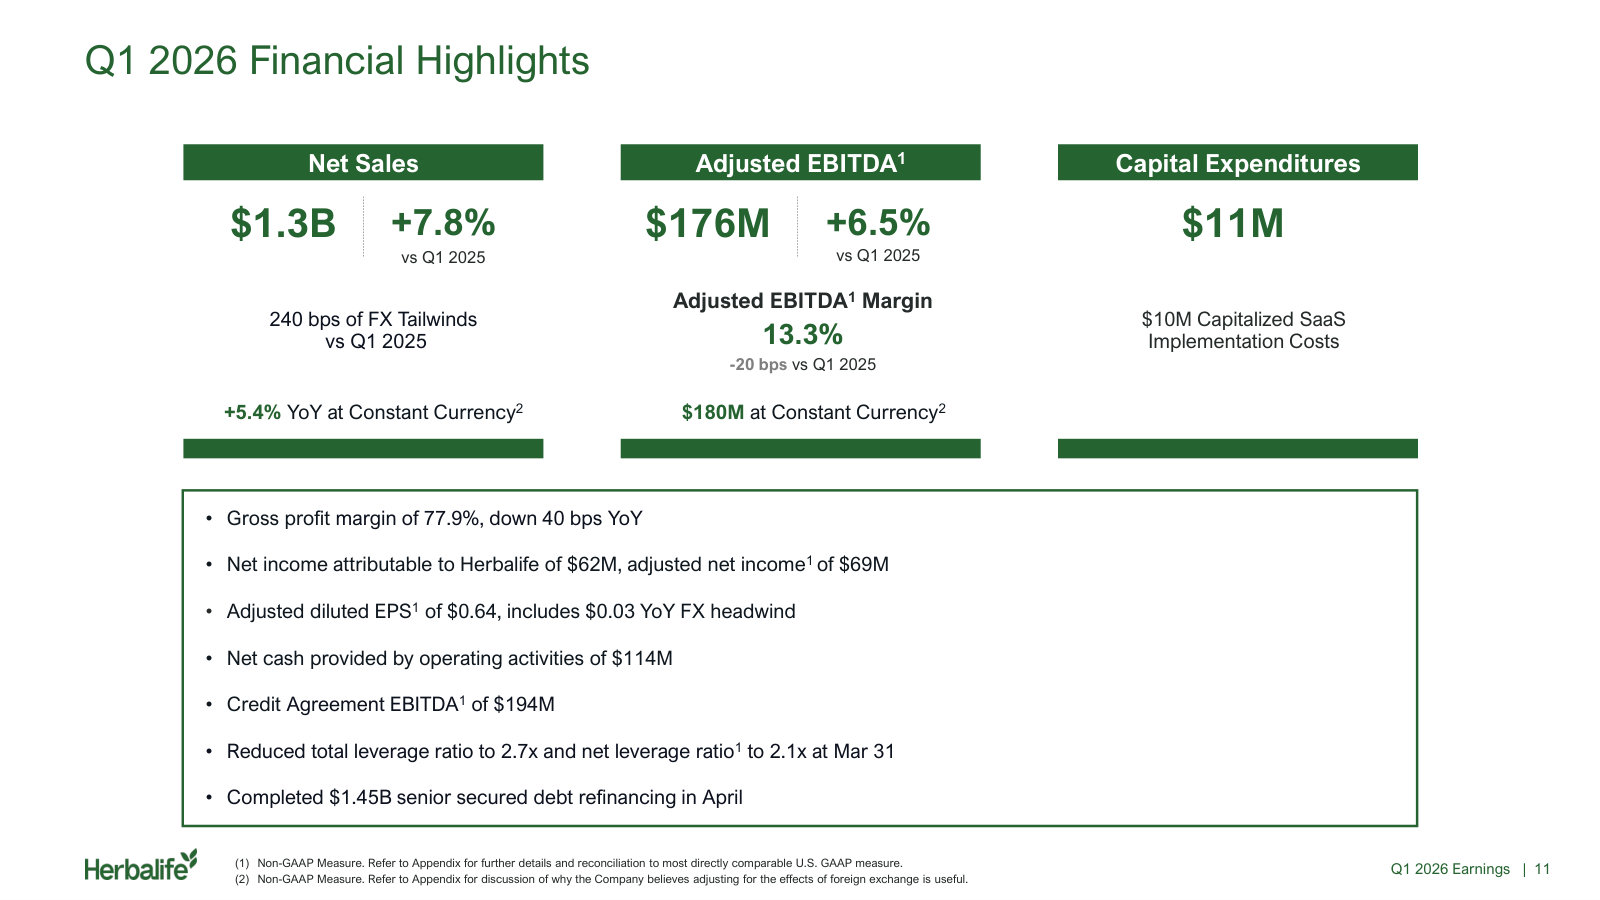
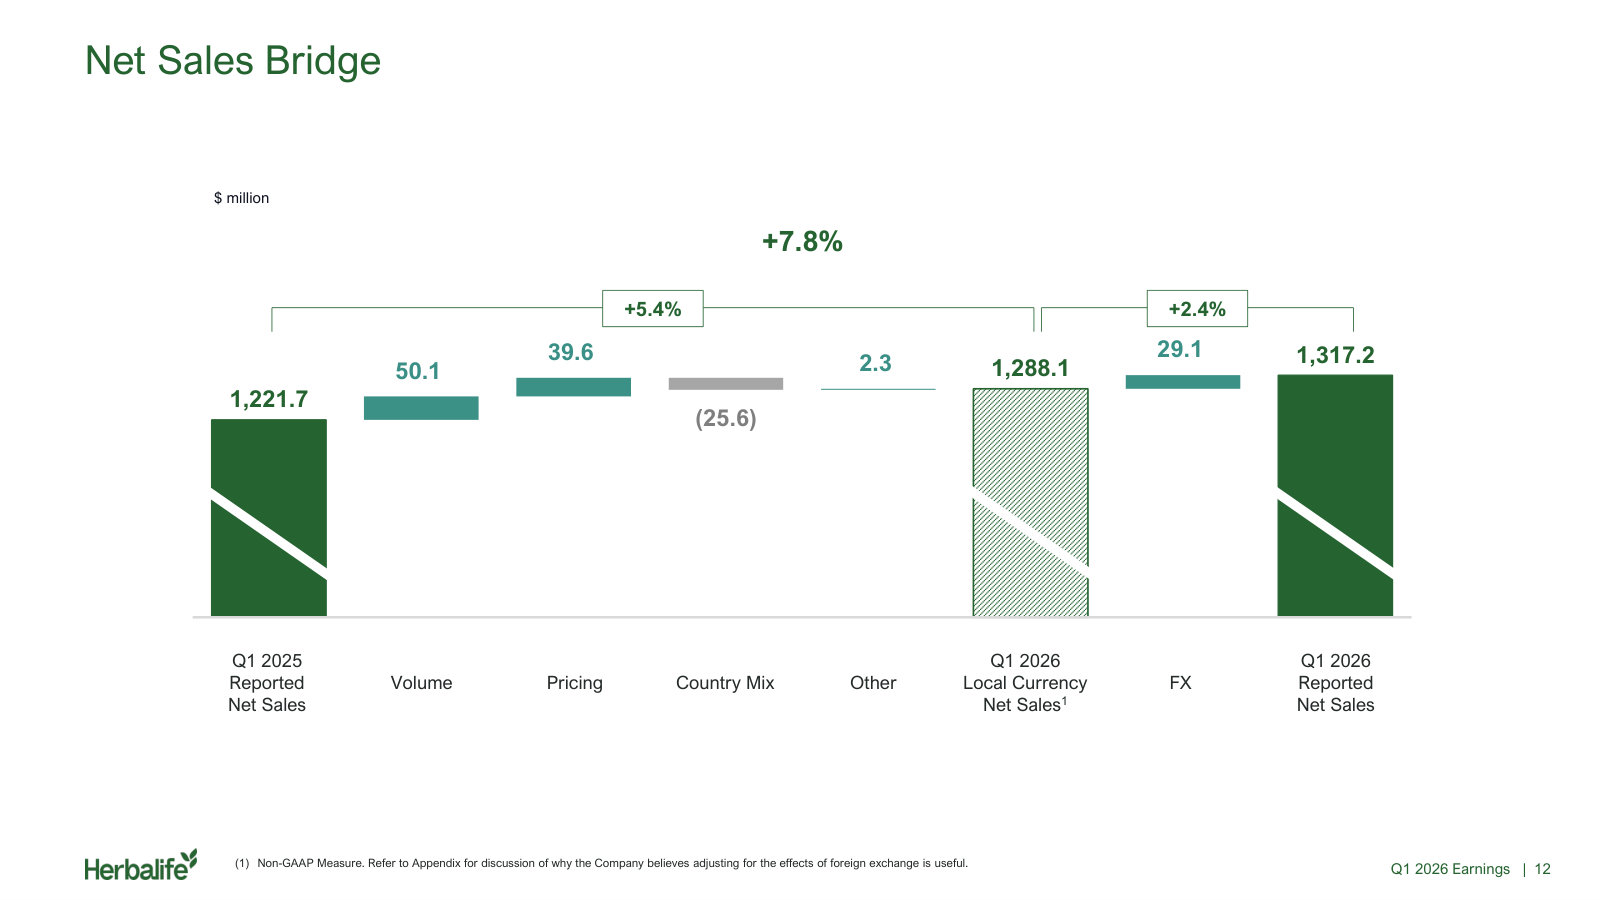
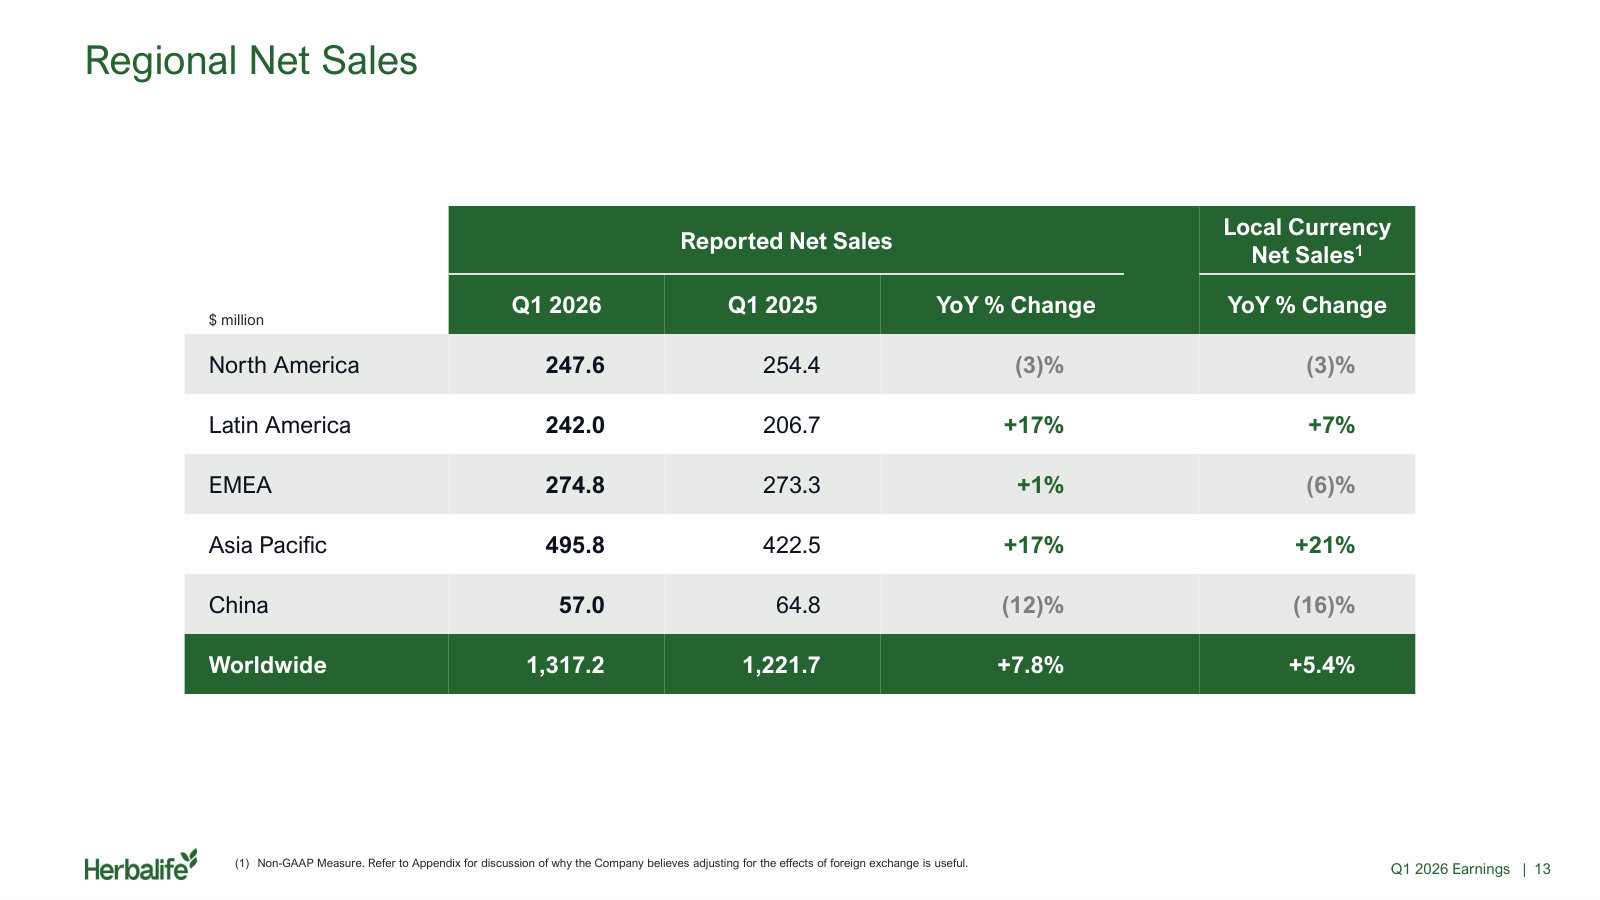
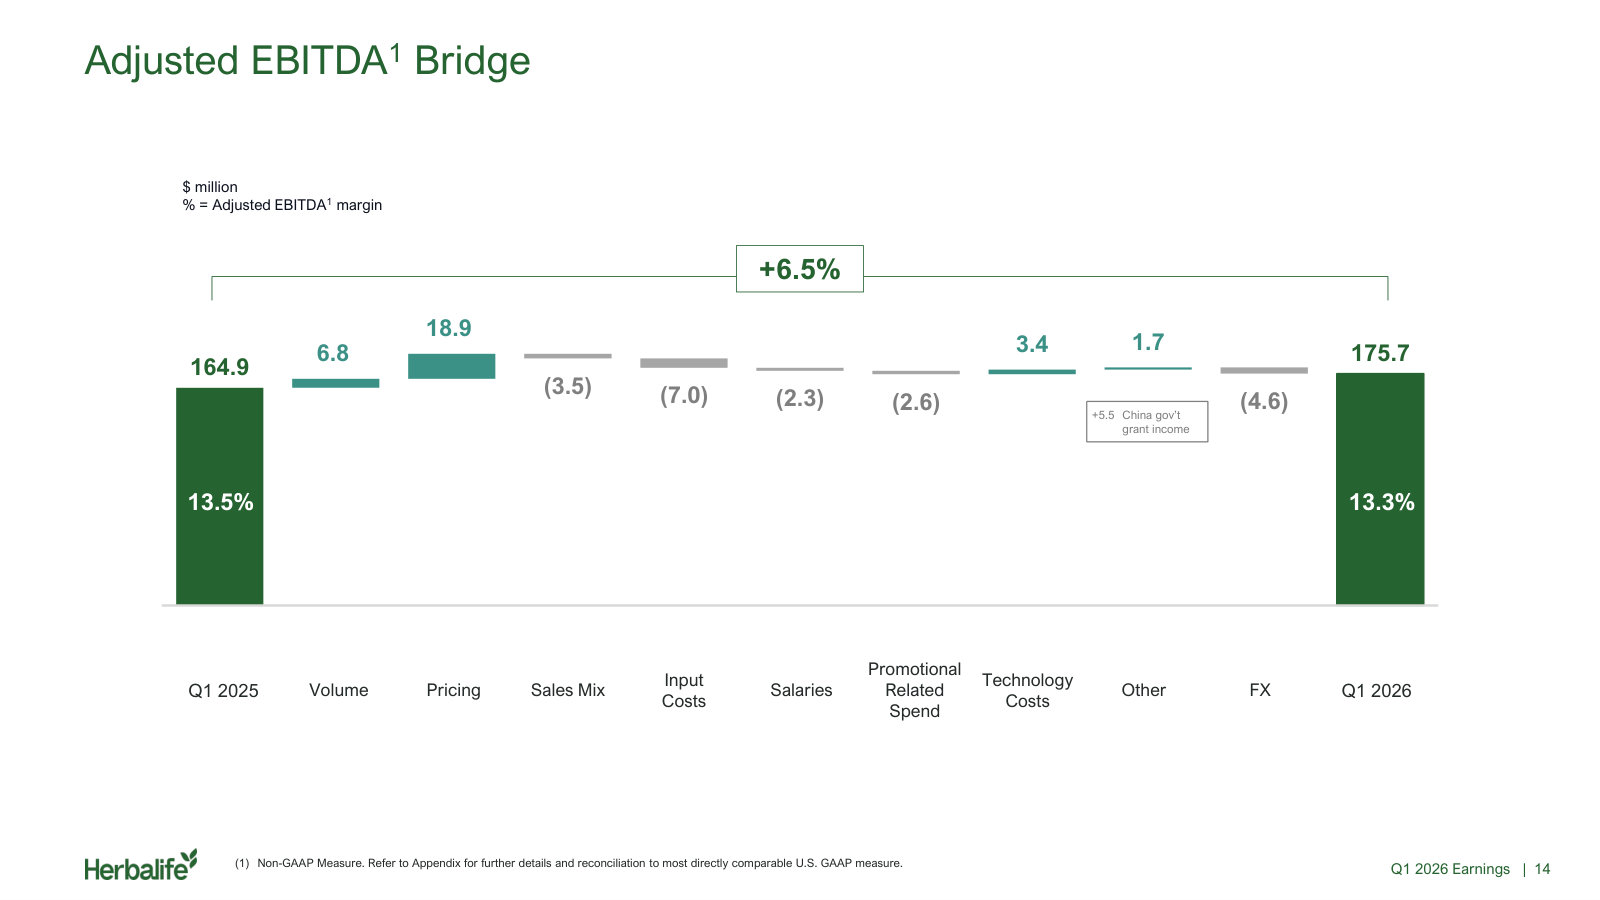
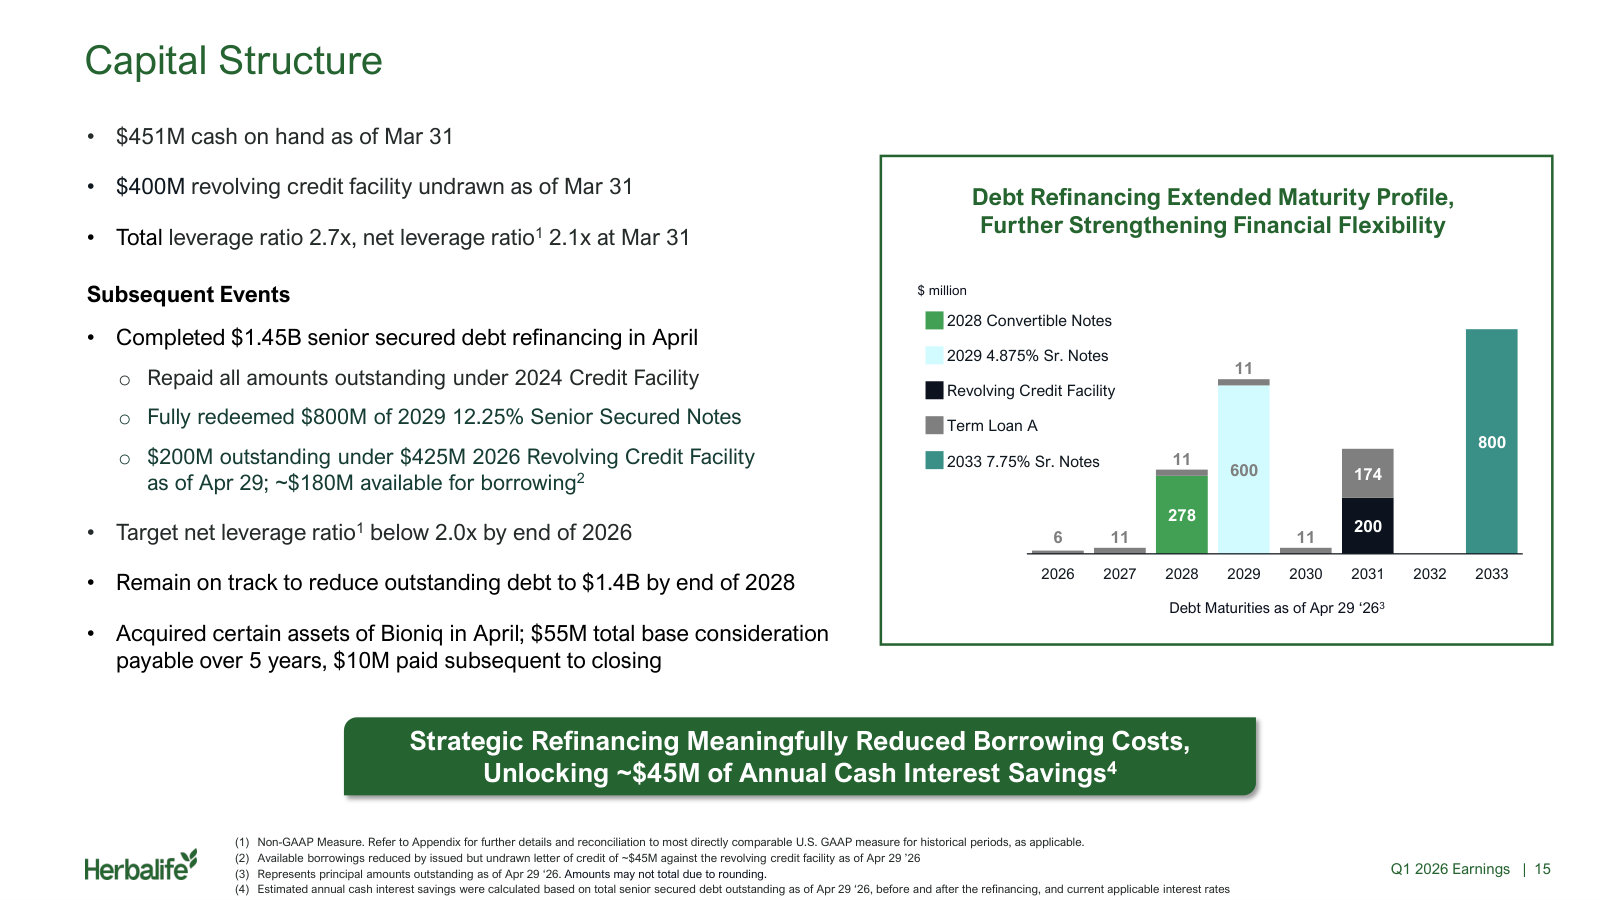
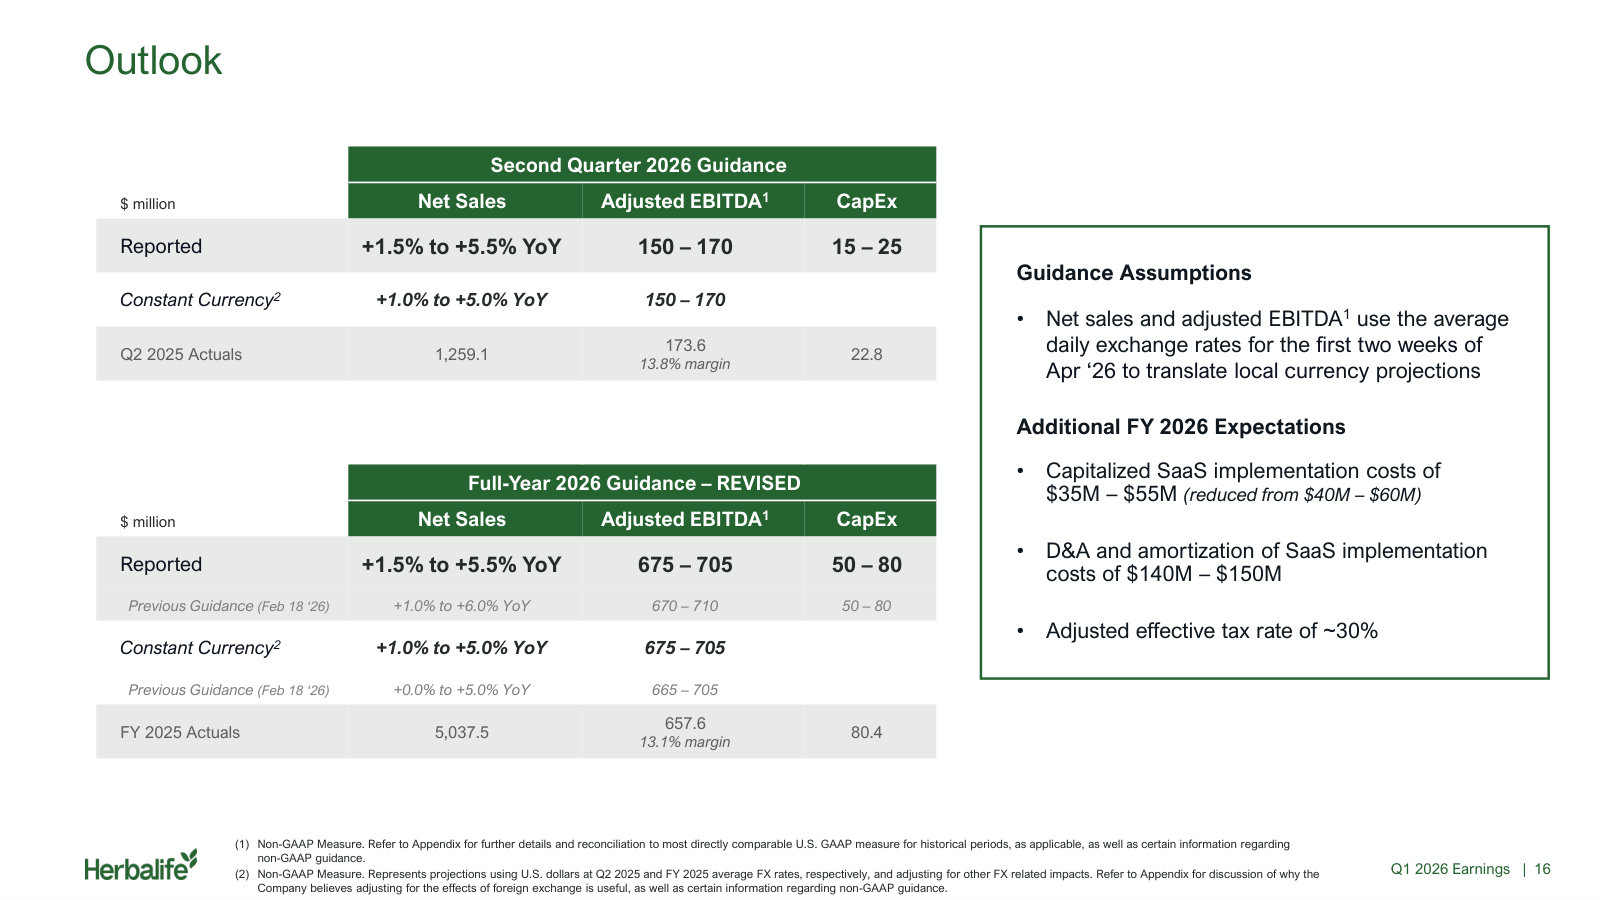
The latest reported quarter: current results, the bridges that explain them, the refinanced capital structure and 2026 guidance. · Open the full document →
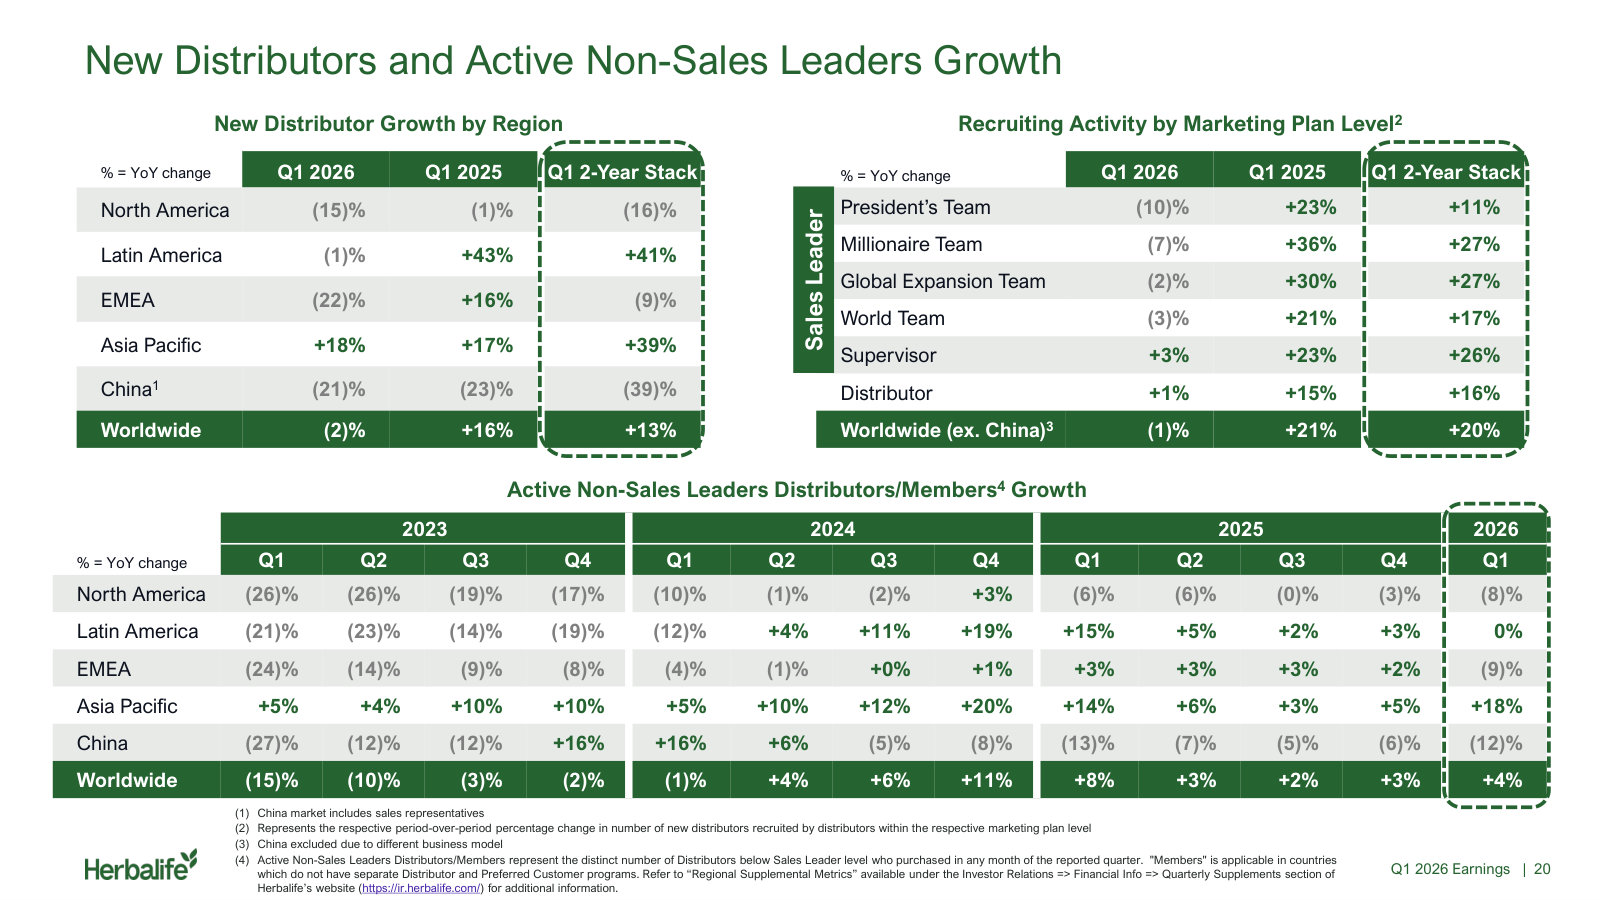
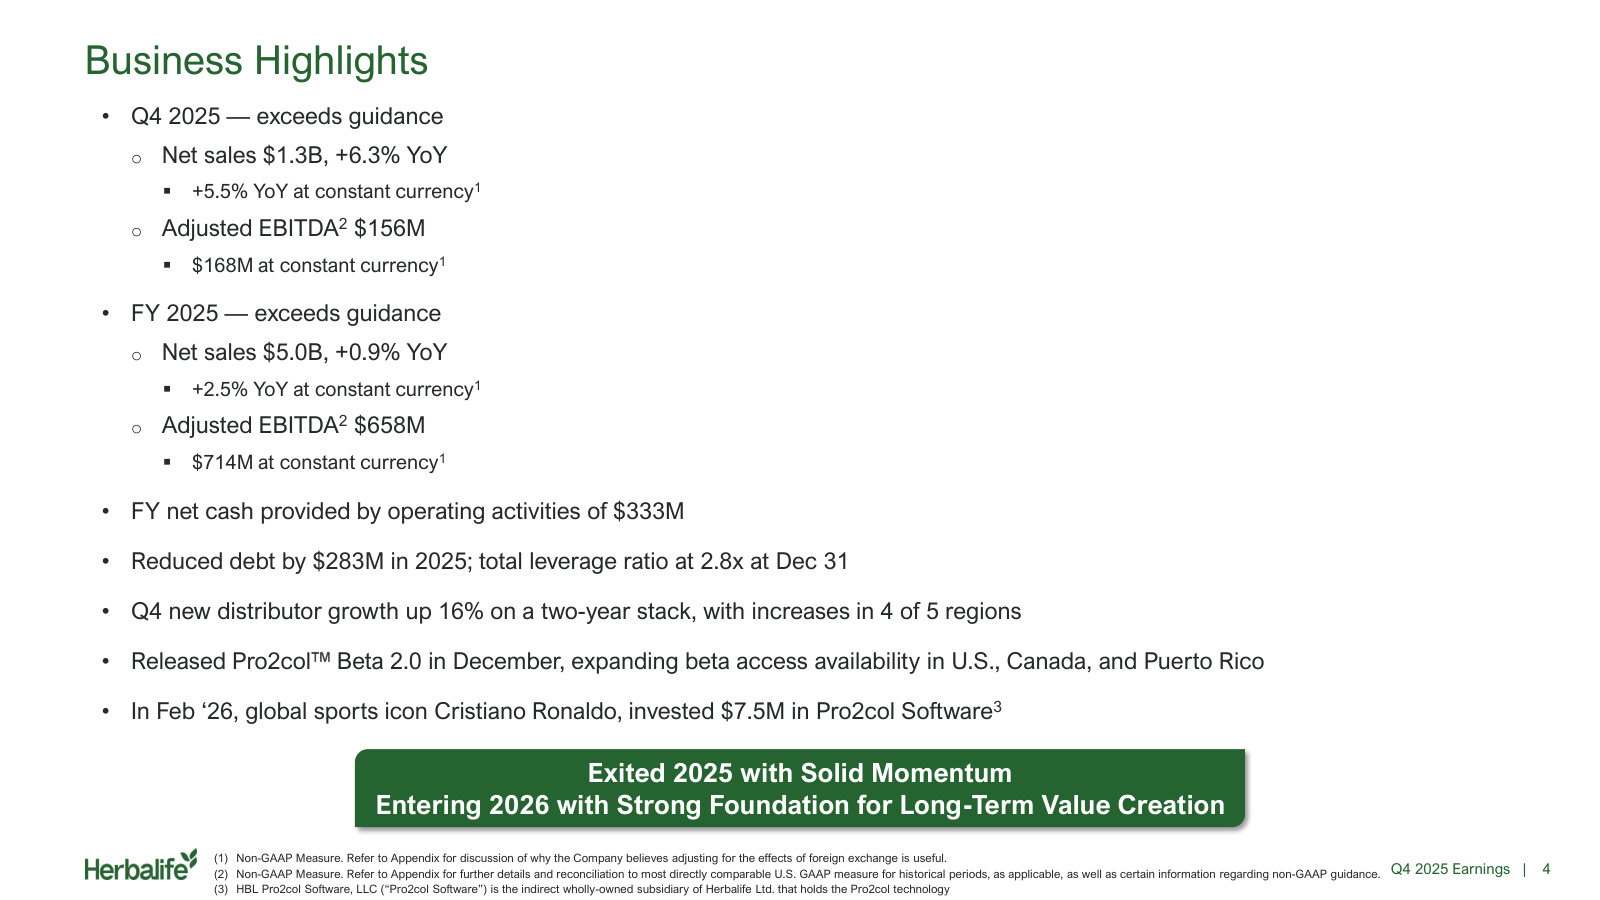
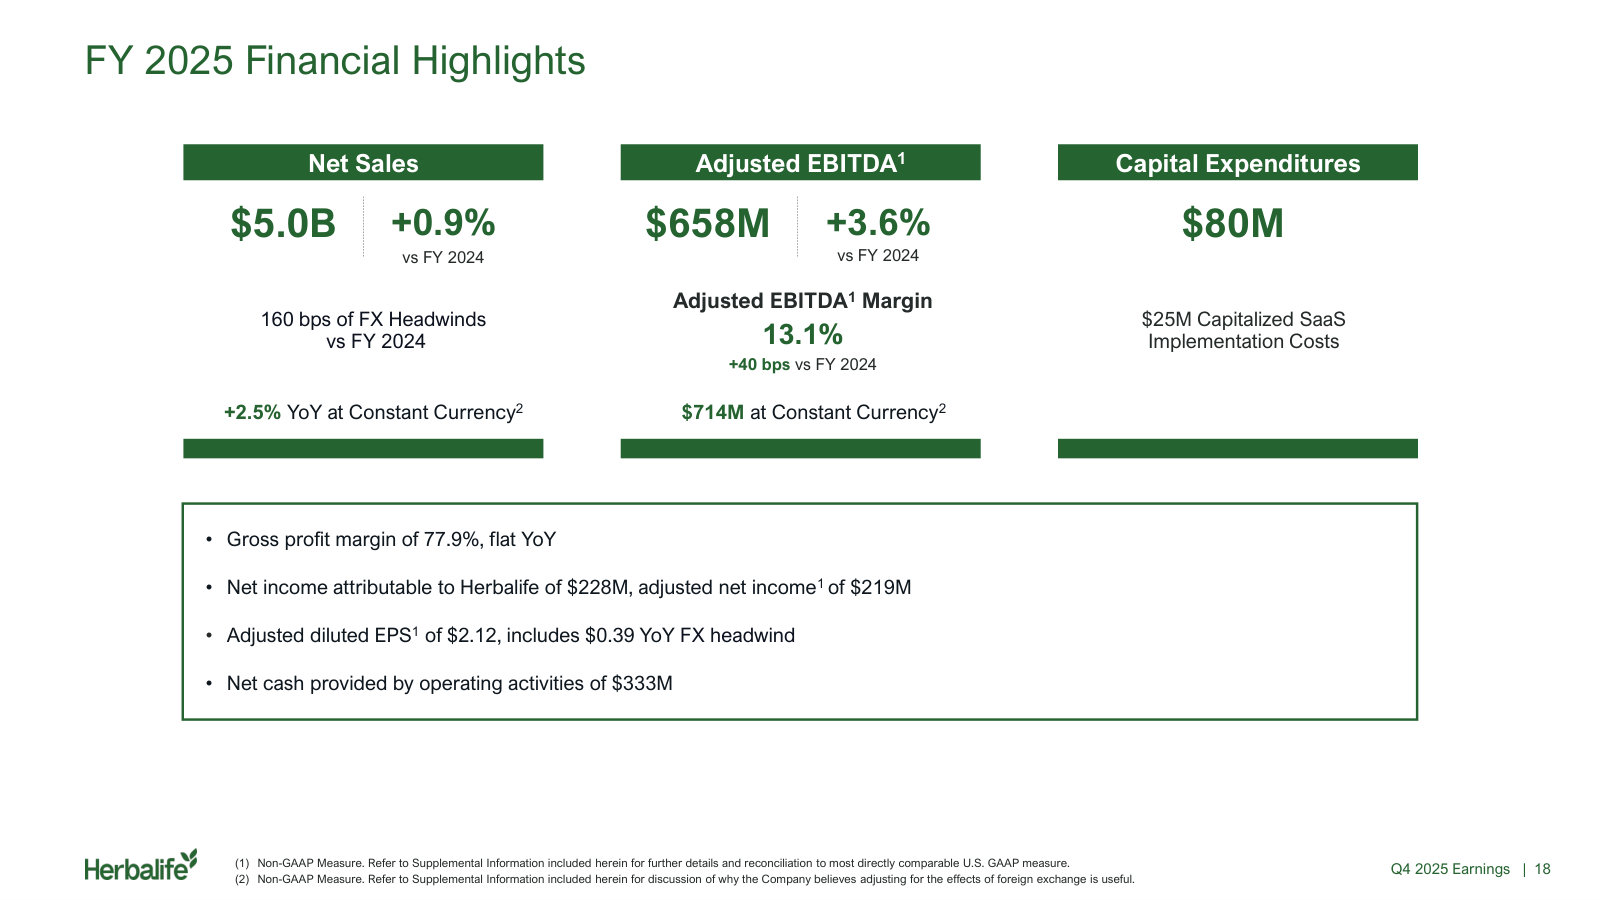
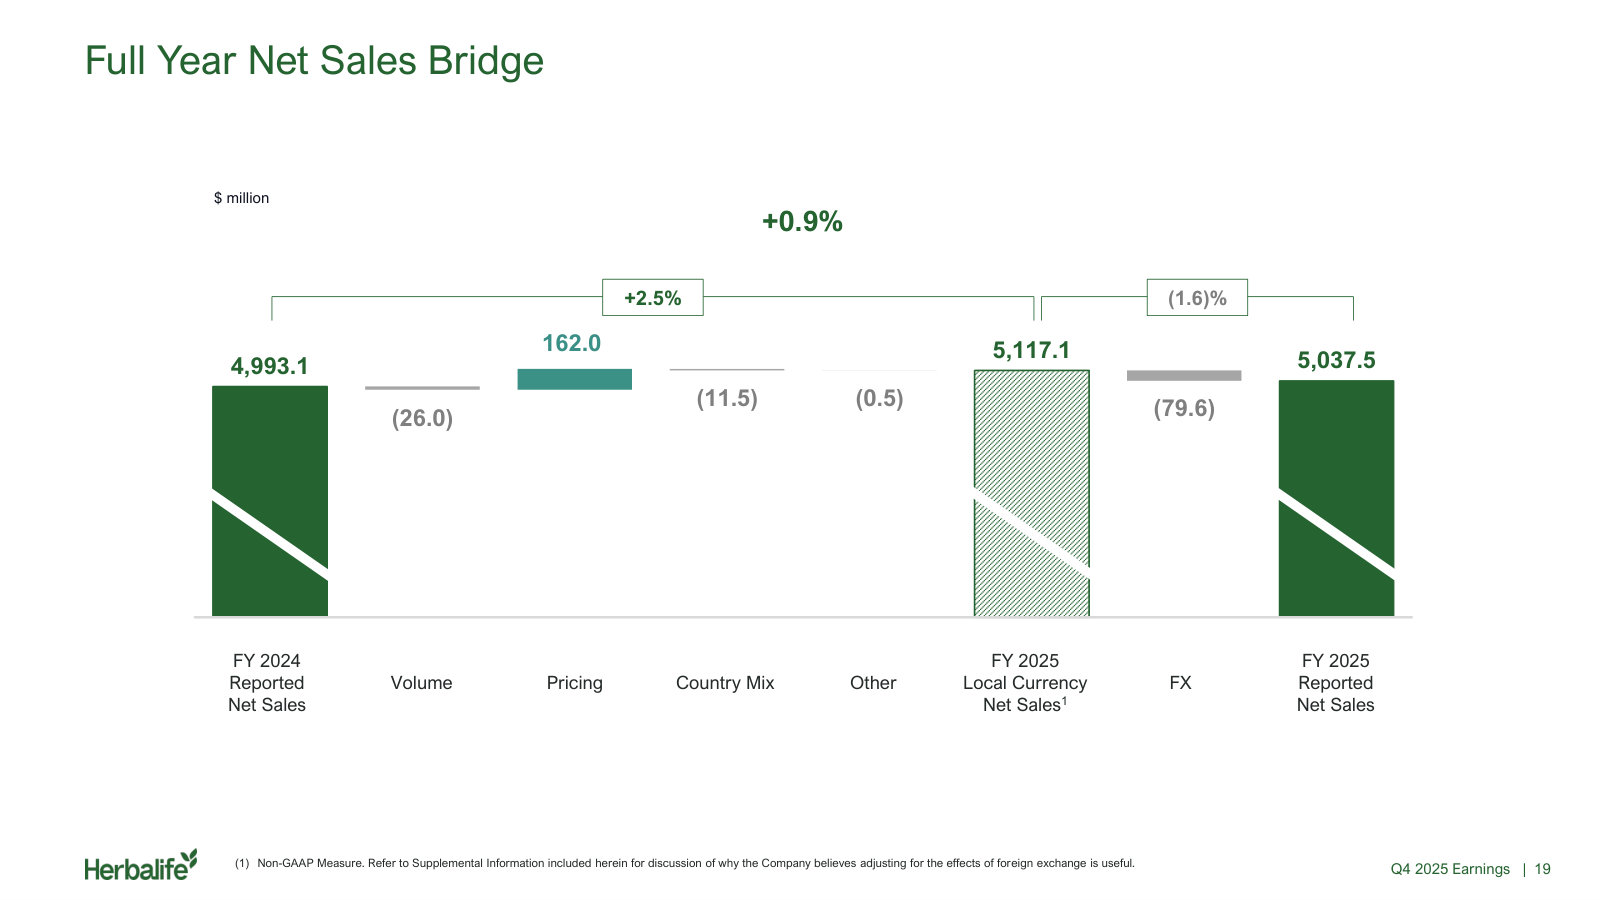
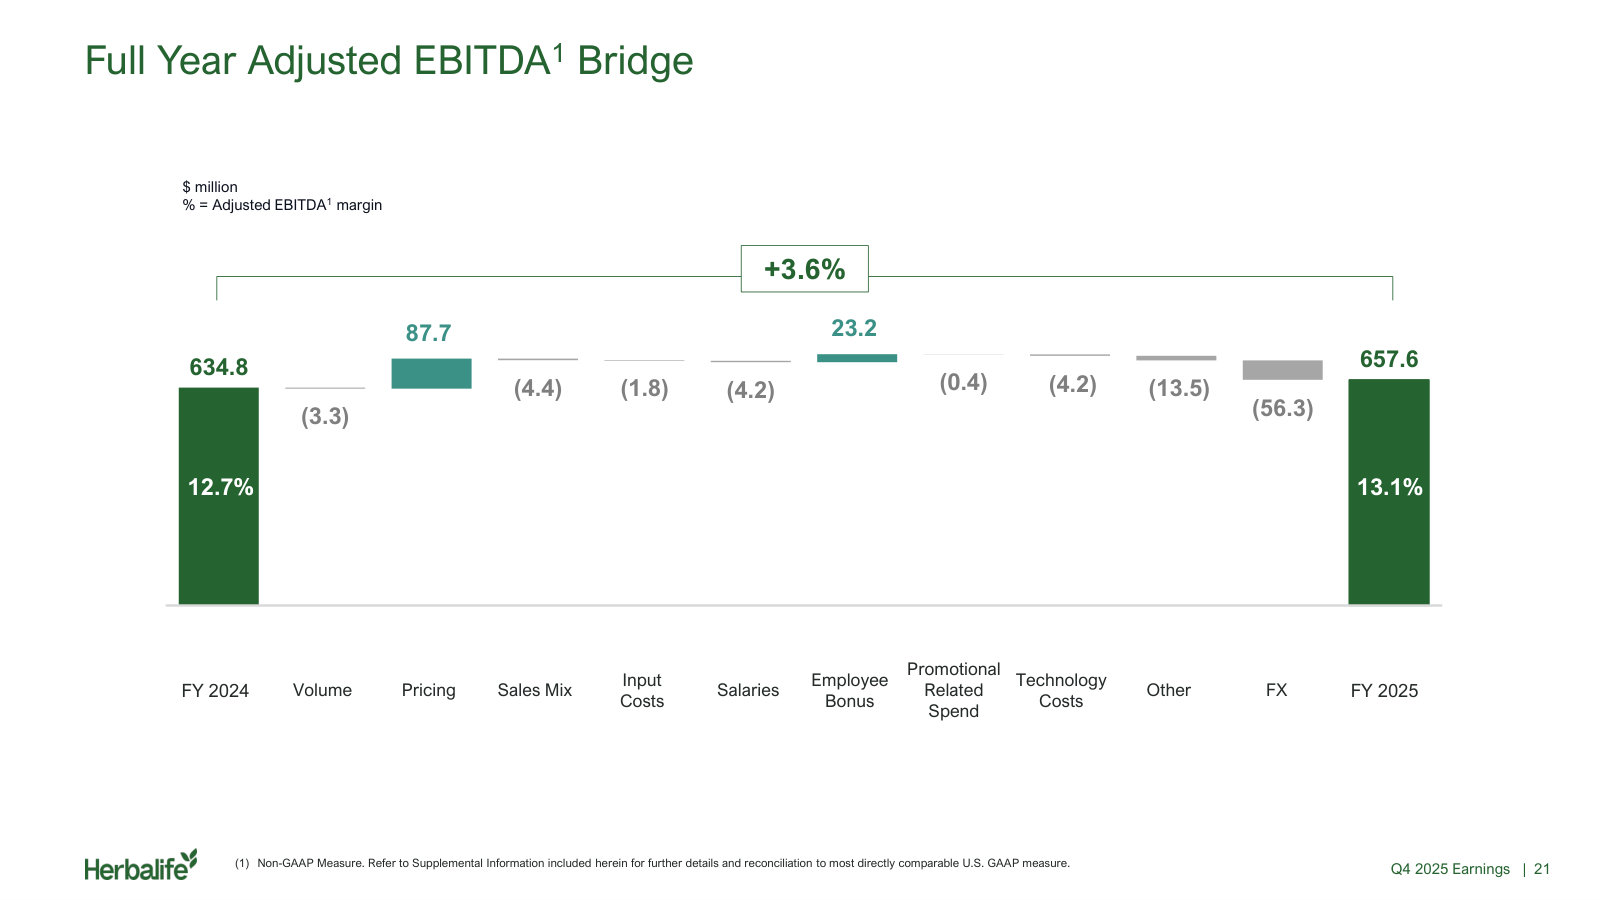
Q4 and Full-Year 2025 Earnings Presentation — Q4 / FY 2025
The full-year 2025 scorecard and the bridges showing what drove the year, the base against which 2026 guidance is set. · Open the full document →
More from management
Q3 2025 Earnings Presentation — Q3 2025 · 28 pages · Pro2col Beta 2.0 ahead of commercial release, and the new Torrance center of excellence. · Open →
Q2 2025 Earnings Presentation — Q2 2025 · 29 pages · Where management first laid out what Pro2col is and how the platform is meant to work. · Open →
Q4 and Full-Year 2024 Earnings Presentation — Q4 / FY 2024 · 25 pages · FY 2024 results and the leadership handover, with Gratziani named CEO effective May 2025. · Open →
Q3 2024 Earnings Presentation — Q3 2024 · 27 pages · The last quarter run by the prior CEO, with the EMEA product and packaging relaunch. · Open →
Q4 and Full-Year 2023 Earnings Presentation — Q4 / FY 2023 · 27 pages · FY 2023, the trough year in this five-year history, and the GLP-1 companion product response. · Open →
Herbalife Ltd.'s management answers for the business every quarter. These are the exchanges that explain it best — verbatim, from the call transcripts preserved in Sources. Each link opens the full transcript at that page in a new tab.
Q1 2026 Earnings Call — Q1 2026
The current state of the story: a third straight growth quarter carried by India, four acquisitions explained as one system, and an explicit statement that none of it is in guidance yet. · Open the full transcript →
How the four 2025-26 acquisitions are meant to compose into one system, with Protocol as the operating layer.
Stephan Paulo Gratziani (Chief Executive Officer): I'd like to take a moment to explain how our recent acquisitions work together to support the four core actions I mentioned earlier, with Protocol as a central operating system. Each acquisition plays a distinct role, and combined, they create greater value than any one capability alone. Let me walk you through how each contributes. Link Biosciences is a formulation and manufacturing engine. It translates insight into products by enabling us to manufacture personalized nutritional supplements in a powder format at scale, directly connecting data and recommendations to the finished product. Vionic accelerates our speed to market with a personally formulated vitamin and mineral complex, in a granule format, while broadening availability through a more accessible price point. Prüvit provides the opportunity to expand our portfolio into the ketone category with a channel-exclusive offering aligned with growing consumer interest in performance, energy, and metabolic health. It is an exciting addition to the portfolio; we will have more to share this summer. And Protocol brings it all together by providing the experience and intelligence layer. It digitizes and scales the four core actions I mentioned earlier—what to measure, what to take, what to do, and who to do it with—bringing greater precision to how distributors support and engage their customers through a more connected, data-informed experience. It translates consumer inputs and health data into actionable guidance that supports more consistent behavior change over time.
p. 2 · Read in context →
A new leverage metric introduced mid-deleveraging, with the definition and the target stated in the same breath.
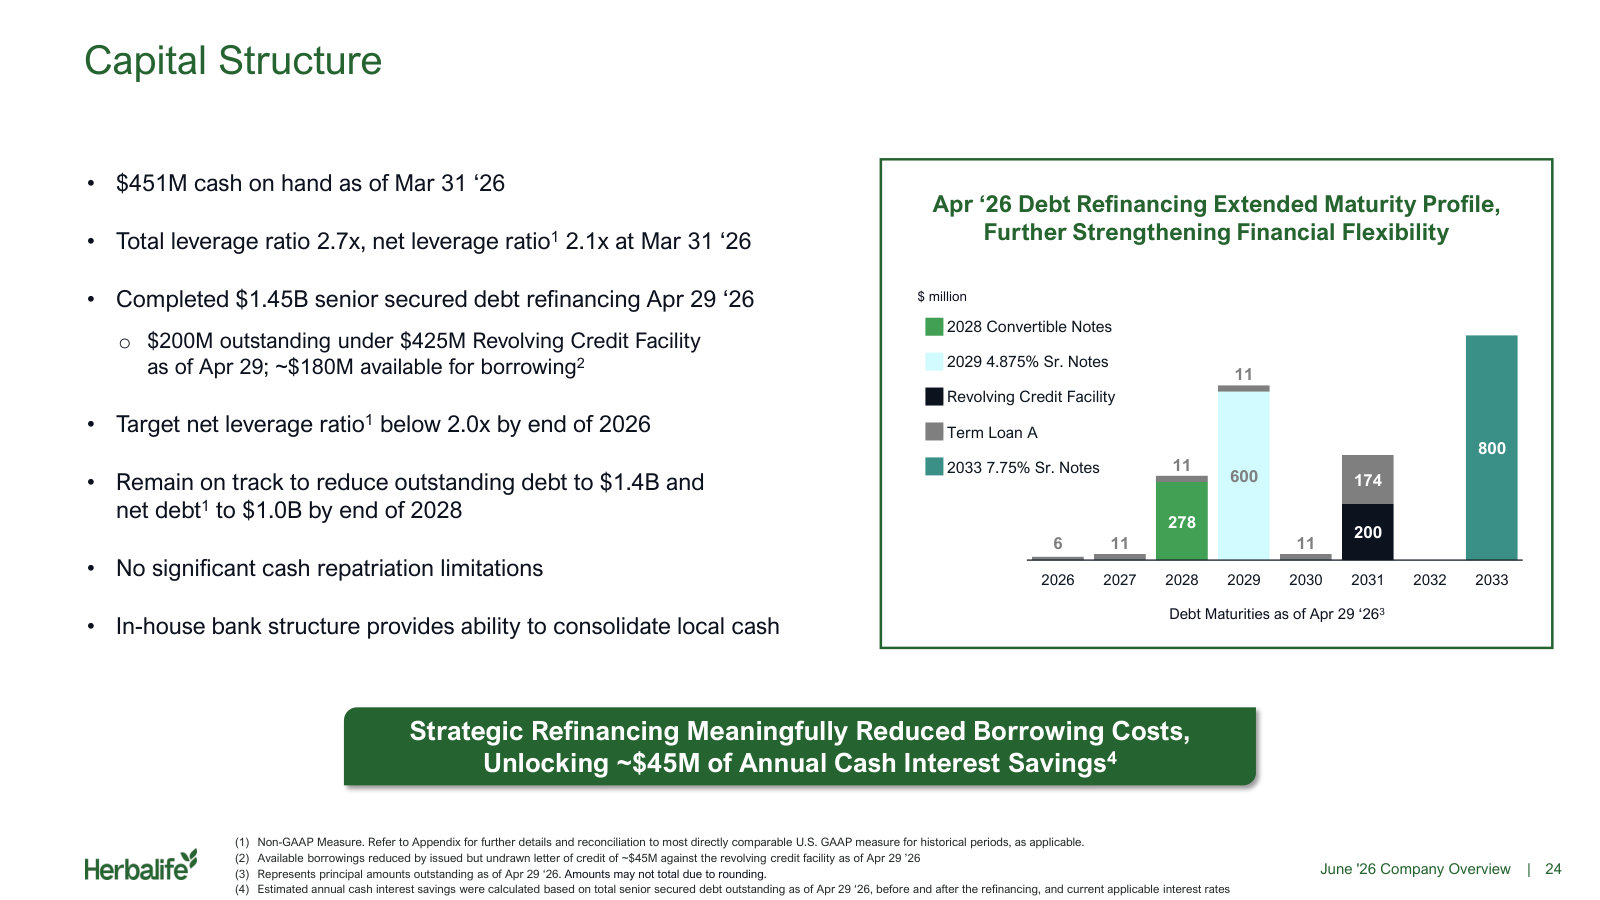
John G. DeSimone (Chief Financial Officer): Credit agreement EBITDA for the first quarter was $194 million and our total leverage ratio was 2.7x as of March 31. Beginning this quarter, we are introducing net leverage ratio as an additional metric to provide greater transparency into our leverage profile and delevering progress. We define net leverage ratio as net debt divided by trailing twelve-month credit agreement EBITDA. At the end of the first quarter, our net leverage ratio was 2.1x, and we are establishing a target to reduce net leverage to below 2x by the end of this year. We believe this metric provides a more complete view of financial flexibility because it reflects debt relative to earnings while also incorporating cash on hand.
p. 3 · Read in context →
India's GST cut as an accidental price experiment - and the read-across management is now testing in other markets.
Chasen Louis Bender (Citi); John G. DeSimone (Chief Financial Officer): My second question is on India. Obviously very strong growth following the GST change. I am curious—given what you have seen—how has your thinking evolved on potential price reduction programs in other markets? And just as a housekeeping related to that, what are you assuming in guidance for India constant currency in the rest of the year? I know you mentioned you are expecting continued momentum, but should we expect that, or does your guidance contemplate the similar 30-plus percent growth in the rest of the year? Thanks so much. […] Yes, Chasen. I will take this. Let me break it into pieces. There is a lesson in India. We had effectively a price decrease due to the GST reduction, and that created a lot of momentum. India had started building momentum just prior to that. A couple things I want investors to know. One is that momentum has been incredibly strong. We are going to annualize the GST in September, but we do not think that means we are not going to grow after. We think the momentum carries forward. Granted, we will be comping quarters that have the GST impact, so the growth rate will moderate, but that momentum we expect to continue. That gives you a little flavor of our thinking of India. India did beat our expectations in Q1. Going forward— if I may break this into buckets—for Q2 through Q4, so the rest of the year, we basically have not changed our sales expectations from where we were in February. They have come up a little, but we had some softness in the quarter in EMEA. We are going to run some tests based on what we learned in India, and hopefully that can work. We also had a price increase in Mexico, plus there was an incremental tax in Mexico, that had a little bit of a volume impact in Mexico on the negative side. That also supports the thesis we are working with the distributors on—that price matters. I think there is a lot of opportunity for us to affect volume in the future by modifying price and modifying the commission structure. So we are running tests. We have been running tests. We are now running more tests based on the results we have seen.
p. 8 · Read in context →
China sized and set aside: about 4% of sales, no profit contribution, and nothing from its turnaround in the forecast.
Karru Martinson (Jefferies); John G. DeSimone (Chief Financial Officer): And just lastly, when we look at China, it has been a work in progress for a while now. How should we think about that, and could you remind us where it stands today as a percentage of your sales? […] It is really small. It is under 5% of sales—about 4%—so it is relatively small. It does not really contribute to profit in any meaningful way. What I have told investors over the last few quarters is we have a lot of strategies we are going to implement in China. I would wait and see. At this point, we are not rolling in the benefits of those strategies. We are going to wait until we see the benefits. Think of China long term as a huge opportunity for us. We are super underpenetrated. The model does well in China for some of our competitors. The products do well in China. We have not found our footing yet. We are working on it. I am confident over the long term we will. You will not see it rolled into our forecast until we see it coming through in results.
p. 9 · Read in context →
The hardest question of the call - is EMEA weakness structural? - answered with a case that the core offer has commoditised.
John Baumgartner (Mizuho Securities); Stephan Paulo Gratziani (Chief Executive Officer): And then coming back to EMEA, to drill down there a bit more, I am curious the extent to which there may be more structural change or softness in the direct selling market given the consistent declines you are seeing in sales leaders, or is it more of a productivity issue you think, or maybe some price adjustments can kickstart growth in that region? […] From a distributor lens—someone that worked in EMEA specifically, which was one of the areas that I spent a lot of time in—I think what has happened is the overall way people look at their health and wellness and make their decisions on what they are going to buy and where they are going to spend money is evolving over time. If you think historically, we started in 1980. The idea of a protein shake in 1980—and I will speak to myself—in 1991, when it came to France where I started, you had to convince someone that the idea of taking a shake instead of having breakfast was actually a thing. They would be like, "You are telling me I am going to mix this up, and I am going to drink this instead of having my coffee and croissant, and that is breakfast?" Today, we do not live in a world where a protein shake is novel and innovative. It is more of a commodity. It is an accepted form. I think part of what is happening is as the markets evolve and as technology evolves, the offer also needs to evolve.
p. 11 · Read in context →
Post-refinancing capital allocation in two sentences: debt paydown still ranks ahead of everything else.
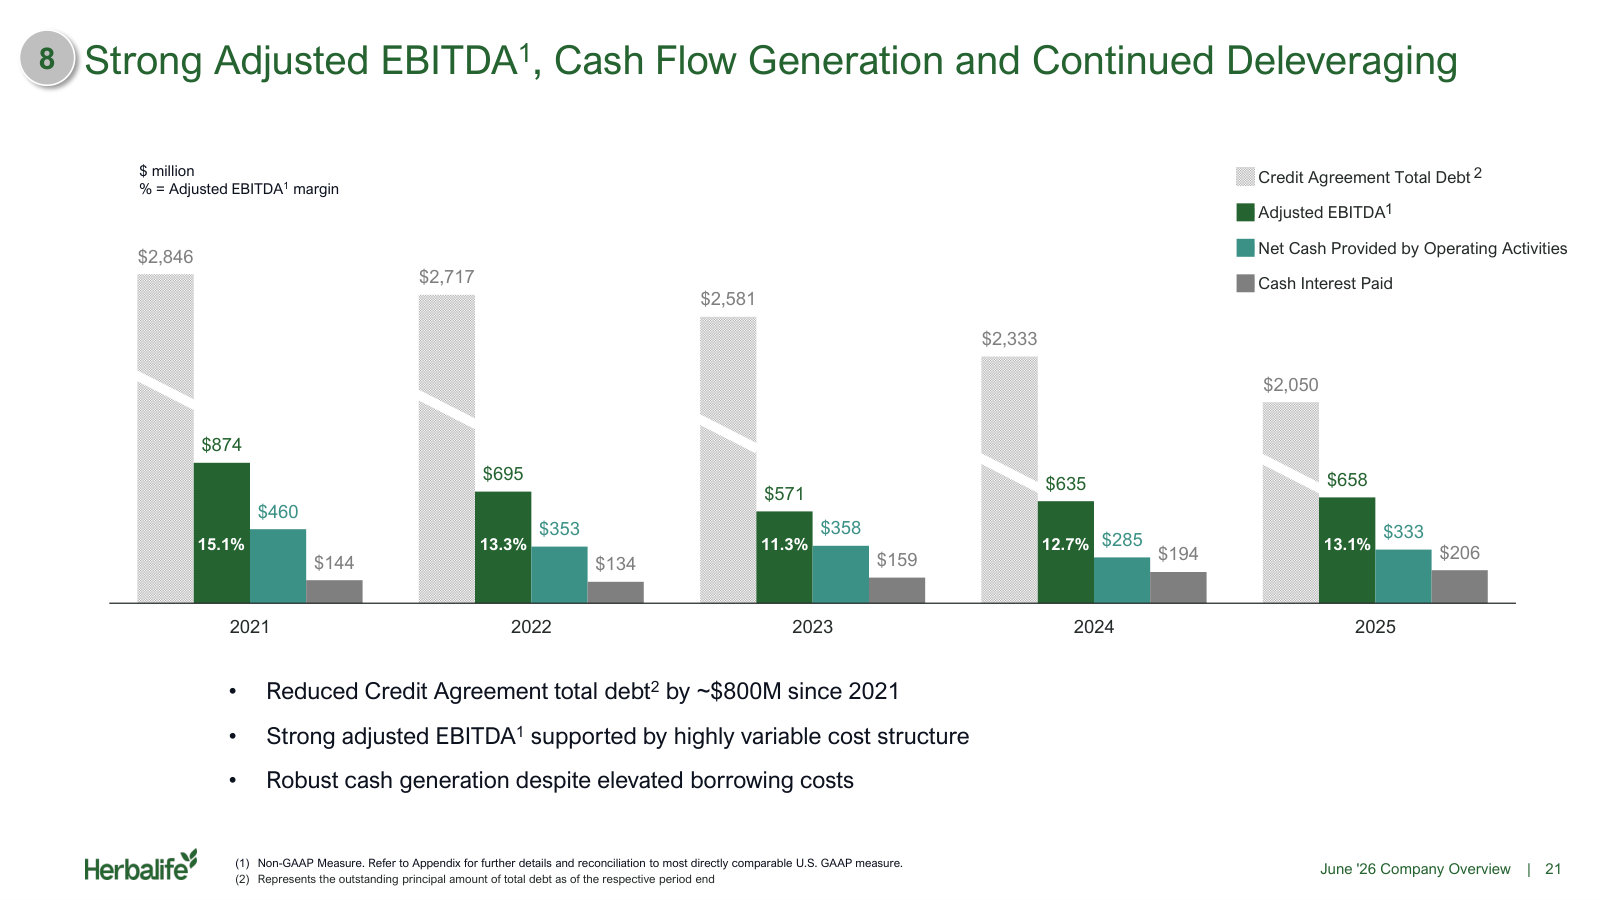
Douglas Matthai Lane (Water Tower Research); John G. DeSimone (Chief Financial Officer): And lastly, John, now that you have completed the debt refinancing, is there any change to your capital allocation priorities? […] There is not. My number one priority is still to get our gross debt down to $1.4 billion by 2028, which would get our net debt below $1 billion.
p. 13 · Read in context →
Q4 and Full Year 2025 Earnings Call — Q4 FY2025
The annual framing under the new CEO - what the personalization strategy is, what rule governs the acquisitions, and how deleveraging is being paced. · Open the full transcript →
The strategy stated plainly: technology is meant to enhance the distributor relationship, not disintermediate it.
Stephan Gratziani (CEO): The human connection has always been at the heart of Herbalife. As a distributor-led nutrition company, our strength lies in th one-to-one relationships our distributors build with their customers. Our distributors take the time to understand a person's individual needs and support them throughout their healt and wellness journey. These fundamentals remain unchanged. What is changing is how we deliver them because we see a future of health and wellness that is even more personalized, datadriven, proactive and accessible. We are modernizing the experience to make it more connected and more effective. We will continue to provide curated product recommendations while laying the groundwork to deliver personally formulated nutritional supplements. Over time, this personalization will leverage data and insights from multiple inputs such as blood biomarkers and connected devices. Central to this strategy is Pro2col, our health and wellness operating system. Since acquiring the Pro2col technology in April of 2025, our focus has been on building a digital experience that supports the strength of our business, leveraging digital tools to enhance, not replace the human connection at the core of our go-to-market strategy. We've implemented a strategic phased beta rollout designed to integrate in-market insights from distributors and customers, enabling us to enhance capabilities and introduce new features in a way that drives the greatest impact.
p. 2 · Read in context →
Two years of deleveraging quantified, with the refinancing flagged as possible and the 2028 debt target held either way.
John DeSimone (CFO): Over the last 2 years, we have paid down over $530 million of debt and reduced our leverage ratio from 3.9x to 2.8x. Our financial profile today is much stronger than it was 2 years ago; and depending on market conditions, we may consider refinancing portions of our existing debt. While there can be no assurances regarding timing or outcomes, a successful transaction could meaningfully lower our borrowing costs. Regardless of whether or not we pursue any capital structure initiatives, we remain committed to reducing our gross debt to $1.4 billion by the end of 2028.
p. 5 · Read in context →
Guidance philosophy on regions: growth expected everywhere but China, which is pushed out to 2027.
Chasen Bender (Citi); John DeSimone (CFO): So I know you guys don't traditionally give guidance by region, but I was hoping you could do a little bit of around the world and give some more color on how you're thinking about sales for the different geographic segments in 2026. I know you called out you're expecting growth in the U.S. But if you could kind of flesh out the comments for your other geographies, especially given the really strong India results and how the GST impact should kind of flow through until we lap those changes, that would be great. […] Yes. So we don't guide by region. I do want to give maybe a little bit of commentary. It'll be very high level. I will say that we're expecting net sales growth in every region with the exception of China. China is expected more of a 2027 event. And that's about, I think, all I really feel comfortable giving out.
p. 6 · Read in context →
Why 2026 margin expansion looks thin: no Pro2col revenue in the plan, and India's GST cut creates an unrecoverable input-tax cost.
Chasen Bender (Citi); John DeSimone (CFO): And then as it relates to Pro2col, obviously, there's a lot of excitement building around the organization on that. I was hoping you could kind of frame your expectations in terms of the sales contribution you're expecting from that program and kind of what you've assumed in 2026 guidance. And then I guess to kind of stay in the realm of guidance, just on the EBITDA side, too. You've exceeded your quarterly guidance in each of the last 8 quarters, and if my math is right, you're only guiding to 20 to 30 bps of margin expansion in '26. It seems like you've built in a lot of flexibility there. So I'm just curious to understand kind of what your assumptions are and what's driving that degree of expansion. […] So Chasen, that's a lot of questions. Let me try to address them all. On the Pro2col side, there isn't much revenue built in at this time. There's significantly more potential for growth than risk. We're currently in the beta phase, having launched commercially in the U.S. in July, and we expect gradual growth from there. We haven't integrated a lot yet, but we will start a few additional beta tests in other markets this year. However, beta testing doesn’t typically generate high volumes; it's mainly a process of acclimation and development. So again, the upside outweighs the downside risk in this area. Regarding SG&A, there is one complication related to the GST in India. A key factor driving sales in India is that the government reduced its GST rate, which is similar to a sales tax, from 18% to 5% for many of our products. This has significantly lowered prices for consumers and has been very advantageous. However, the GST rate for the services provided by our distributors and for our intercompany services remains at 18%. We previously could offset the input and output credits, but now we cannot. As a result, next year, we will face an additional cost of about $16 million from G&A and member compensation due to GST. This will have a negative impact on our bottom line. Our margins, excluding GST, would be approximately 30 basis points higher than what you see in guidance. Even so, we anticipate margin enhancement and improvement next year, which is important to note. There is a slight negative effect on the percentage due to the GST in India. Nevertheless, the GST in India is beneficial for our business as it boosts overall volume.
p. 6 · Read in context →
How the two recruiting funnels differ, and why a 2024 incentive design tilted the mix toward distributors over customers.
Carolyn Popelka (Barclays); Stephan Gratziani (CEO): My question relates to the distributor to member model. We've seen pretty outsized distributor growth, especially on a 2-year stack. So I was wondering if you could expand on the relationship between distributor growth and members growth. I think intuitively, with the current market, you might think more people want to be distributors looking for extra income, but on the other side, people might have less discretionary income for health and wellness. So is there a mismatch there? […] Well, look, it's both. The opportunity that people are looking for to have a financial opportunity, I think we're all clear that, that remains and will continue to remain something that there's a large attraction and interest and need for. At the same time, you said it. Health and wellness and people taking care of themselves and reaching their goals and what's important to them is also a major factor. The one thing that you might see just in terms of the distributor recruiting numbers versus the preferred member numbers is that we did launch 2 years ago something that we called Herbalife Premier League, which put a bit of a focus on distributor recruiting. And when we did that, there was a little bit of a focus on distributors more than preferred customers. For the first year that we ran the program, it ended up having more of a focus on the distributors. We made an adjustment in 2025 to actually account for preferred customers because a lot of markets in their models and flows they really kind of led with preferred customers. So I think as you see those numbers, there might be some level of fluctuation. All in all, it really depends on the distributor models. We could have more preferred customers in India, it drives a lot of growth for us. It's not direct distributor recruiting that drives because it's really attuned to their model and the way that they actually build the business there. So I would say both remain highly interested and attractive, and our distributors are focused on both.
p. 9 · Read in context →
Q2 2024 Earnings Call — Q2 2024
The best call on how Herbalife actually makes money: a live experiment in resetting price, distributor payout and qualification thresholds together, plus the debut of the $1 billion debt-paydown commitment. · Open the full transcript →
The clearest account of Herbalife unit economics: price, distributor payout and marketing-plan thresholds moved together in one market.
Chasen Bender (Citi); John DeSimone (Chief Financial Officer): And then in terms of pricing, obviously, pricing was once again a strong contributor to overall net sales growth in the quarter. But you called out this pilot program in Latin America whereby you took a reduction in that price across most countries ex Mexico. I was hoping you could expand a little bit on that. What are the benchmarks you're looking for in terms of success that would then lead you to roll that out more globally and related, what sort of timeline might we see you make those judgment calls on and subsequently roll that out to other markets? […] Yes, that's a great question. So let's start with the strategy behind the changes that we've made. Historically, at Herbalife, we've had pretty much the same approach to pricing and the compensation system to our distributors globally. And the reality is that that's not really a level playing field given that the socioeconomic differences across the 95 markets that we're in. So what we did in most of Latin America, South America, specifically and Central America was lower the price so we can reach more consumers. That was one thing. Second, lower the compensation plan earned by distributors and us, by the way, right? It's a little bit lower margin percentage for everybody. And third, actually make it easier for the distributor than to qualify going up the marketing plan because the average purchase per customer in some of the poorer countries is pretty low. And so to reach the threshold that had previously been set, they need a lot more customers than a lot of other countries do. And that creates more effort and almost an unlevel playing field. So what we're ultimately trying to do is optimize those variables within a country to maximize the earnings, and that means the earnings for the company and the earnings for distributors. So the measure for success is are we generating enough increase in volume to not only offset the price decrease, but that we're all putting more money in the bank at the end of the day by making these changes. So that's the objective. I think it's strategic. I think it's an important pillar for the future.
p. 8 · Read in context →
The $1 billion debt-paydown commitment when it was new, with the reasoning for choosing debt over buybacks.
Hale Holden (Barclays); John DeSimone (Chief Financial Officer): $1 billion debt paydown target over the next four to five years felt like it was a new, new, new to me. Is the expectation that you guys would sort of pay as you go every quarter over the next couple of years and chip away at it or take it more in chunks? […] Well, it is new news, okay, is that we're committed to paying down $1 billion over the next four to five years. I think that was that question that's been coming up is once we pay down the 2025, what are we going to do with that free cash? Are we going to buy back stock? And we just want to make it clear. We continue at this point, given the cost of debt and the tax friction of it that we think under the current circumstances, the best option is to continue to pay down debt. So I think that's an important takeaway from the call. And I think that it just transfers value to equity holders. So I think that's a good backstop. Second, how we do that will be circumstantial. It all depends on the maturities of the debt and what the penalties are for buying back early and how much cash we're generating. So I'd like to do it quarter-by-quarter to the extent that we can and that the economics work out because the interest costs are pretty high.
p. 10 · Read in context →
Why prices were cut: in some markets the payout structure had confined the product to the top tier of consumers.
John Baumgartner (Mizuho Securities); John DeSimone (Chief Financial Officer): And I just wanted to better understand the catalyst for this change. Were you receiving feedback that prices just became too high, whether for the category or the channel? […] Well, I think it started about 5% to 6%, maybe even more years ago and actually started from an initiative Michael pushed over to me at the time. Regarding pricing of our products in certain markets because in certain markets, our products seem to only be able to skim this top surface of consumers. And that was because of the amount of payout we had to make associated with those products. So it started with us, and it started with years of communication with our distributor leaders trying to build confidence on what we were trying to do, trying to share in the risk associated with it and recognizing that a lower price with a different payout can actually be more profitable from a dollar standpoint to them and us if we can reach to more consumers. And so I think it started out maybe from inside out, but what's happened in the recent past is it's been more outside in now pulling on those ideas.
p. 12 · Read in context →
The margin arithmetic of the price reset: gross profit falls, contribution margin much less, because distributor payout moves with it.
John Baumgartner (Mizuho Securities); John DeSimone (Chief Financial Officer): Is the thought process, if you do scale this more broadly, I guess now it's not going to have that much of a margin impact on the overall model. But if you roll this out more broadly where it may have an impact on margins, is the thinking that with the restructuring savings you have the transformation program, you can basically sort of absorb that kind of downward reset margins without having the impact at the bottom line? Is that basically the thought process? It gives you the kind of flexibility to be more creative on the pricing? […] So I mean, I think we can more than offset it. So I think there's pluses and minus in this, right. So gross profit actually as more of these types of pilots are pushed out, then you'l see maybe a negative impact to gross profit. But you won't see nearly as negative impact to contribution margin because the payout structure to distributors also changes. And then we can reduce our SG&A. So that's kind of the plus when you think of the countries we're doing this with they’re not necessarily these big countries that make up the majority of our sales. But it does offer an opportunity to some of the smaller countries that may, in fact, be small because the pricing only reaches the top tier consumer.
p. 13 · Read in context →
Why recruiting can turn positive while active distributor counts do not - the lag between the two, explained.
William Reuter (Bank of America); Michael Johnson (Chairman and CEO): I thought that there were active numbers in your slides that I was looking at prior to the call that the difference in the trends versus the recruiting numbers would be different. Is that not the case? […] Well, the recruiting numbers start to add on, right? So it's cumulative over time. So if you're bringing in x-amount one month and you're adding another group the next month, the next month, and the activity rate actually is those that are stopping being active and those that are joining that are starting to be active. So we didn't specifically talk about that. But what ends up happening is when you've had those 12 quarters of decline in recruiting, there's a tail to it, right? So you actually have less and less people over time, now we're starting to add in, and that's why we make the comment that one quarter is the beginning of the journey. What ends up happening is that you end up having as you add on consecutive quarters and consecutive months you'll reach the inflection point, right? There will be this time at which kind of the consecutive 12 quarters kind of starts to run out and then all the add-on meets at that point. And that's the inflection point. And so you may not be seeing it driving now in the overall total active numbers, but eventually, that point will come.
p. 15 · Read in context →
Q4 and Full Year 2023 Earnings Call — Q4 FY2023
The reset call - nutrition-club economics disclosed for the first time, the GLP-1 position settled, and a flat-year guide with the reasoning behind it. · Open the full transcript →
Pressed on how high club conversion can go, management ties it to service mix rather than promising a number.
John Baumgartner (Mizuho Securities); Stephan Gratziani (President): And then as a follow-up, your comments on the preferred conversion rates in the U.S. Nutrition Clubs, I think I heard the spread was like 1% to 10%. And I'm curious, I know it's very early days and it's a pretty wide network, but I guess how do you think about where that spread should be? Is 10% at the high end too low?
Can it be 20%, 30%? I'm just sort of curious like what you would think is sort of achievable going forward as you implement these sort of resources. […] Yes, so it's really kind of model-based, right? By the way, we give 10%. There's over 10%, okay? It's not the majority of people. Obviously, it's a small subset of people.
But when we actually break it down, it could be their demographics, where they're living. It could be, and most of the time is, the models that they're doing and the services that they're offering. So, if it's just foodservice, for example, the conversion, we know is much lower, they're more focused. There are maybe higher-volume clubs where they have more customers coming in and out, and they are just doing everything that they can to make sure the customers get the service that they need to buy the food item that they're trying to purchase and be on their way. Other clubs, they have better conversion.
People are coming in. What they're coming in for could be a variety of things. They might be coming in, some of these clubs have workouts that are happening a couple of times a week. Some of the clubs, people are doing wellness evaluations. Some of the clubs, they're running challenges where they'll have weekly meetings, and they'll have groups of people that are coming in.
Those types of clubs have higher conversion. So, we believe long term that the more people focus on multi-services, the higher the conversion is going to go.
p. 14 · Read in context →
The GLP-1 answer that set the company's position: no drug, no corporate partnership, complementary product sold locally.
Linda Bolton-Weiser (D.A. Davidson); Michael Johnson (Chairman and CEO): And then just in terms of the GLP-1 stuff that you talked about, that's very clever that they're reaching out to prescription providers to look for clients. I'm just wondering if you're in the works for doing something more formalized, some sort of partnership where you can actually partner with a GLP-1 provider to get a funnel of kind of customers? Is that something you're thinking about? […] Linda, it's Michael. I've been waiting for that question from you. So, we have studied this really carefully. And we've looked at health care providers, telehealth. We've gone back and forth on it.
We think the best method to the marketplace for this is to work locally, is to work with the opportunity for our distributors to work with longevity clinics, work with doctors, work with different areas in their local marketplaces to provide a product that's complementary. We don't see ourselves in the near future offering a GLP-1 product. We believe that our strength is in the behavioral modification, giving product to people that complements a GLP-1 user on their journey. As you know, you're on that personal journey. And so, that opportunity for us is – the beauty of this is to build a long-term customer who will use the GLP-1s on a temporary basis and to work with local opportunities, whether it's a health care provider, whether it is a telehealth company on a local basis, through our distributors and not on a corporate relationship.
p. 17 · Read in context →
Capital allocation gated on leverage: 3x is the target, and buybacks are off the table until it is reached.
Douglas Lane (Water Tower Research); Alexander Amezquita (Chief Financial Officer): So, have you articulated a target leverage ratio that you're shooting for? And then is there some point where a stock buyback makes sense? […] So, our policy around 3x total debt is still our target. That is an investment-grade target. We are – our excess cash flow right now, we ended 2023 at 3.9x. So, our excess cash flow is going to continue to pay that debt down until at least we get to the 3x target. And we have plans to get there with the continual paydown of the free cash flow generation. […] Well, we need to get the 3x target before we can ever consider that. But again, Doug, our focus right now is getting our debt levels significantly lower than where they are today.
p. 20 · Read in context →
Q3 2022 Earnings Call — Q3 2022
The call where the thesis broke: guidance withdrawn, the CEO returning for a third time, and management conceding it could not separate price effects from macro effects. · Open the full transcript →
The guidance withdrawal itself, and the reason given: consumer behaviour moving faster than the company could forecast.
Alexander Amezquita (Chief Financial Officer): And sixth, while we anticipate trends that emerged in the third quarter to persist into the fourth quarter, we are not able to forecast in an environment with such rapidly shifting consumer behaviors and volatility in the world at large. As such, the company is withdrawing fiscal year '22 guidance. We will revisit our ability to provide 2023 guidance at our next earnings call in February.
p. 3 · Read in context →
Why pull guidance with two months left - the answer points to distributor productivity, not just macro headlines.
Chasen Bender (Citi); Alexander Amezquita (Chief Financial Officer): Can you maybe just expand on the rationale for why you're withdrawing guidance? I mean, I get the macro is tough and there's the lockdown in China, conflict in Ukraine, inflation pressures, you name it, but these aren't new issues per se. And with just two months left in the year, I guess I'm wondering, why pull guidance now? And what does this really mean in terms of your ability to forecast the business? […] Yes, so it's a good question. So while a lot of the headlines aren't necessarily new, we've been dealing with the pandemic, the fallout of the pandemic, the issues around the supply chain, all of those are largely new. What we have seen through the third quarter is a pretty dynamic shift in consumer behavior and purchasing behavior. As you know, largely, we've been focused on active sales leaders and the introduction of new distributors and preferred customers as key KPIs throughout the year.
But what we saw in the third quarter was a reduction in productivity in it as well. And so what appears, and again, this is just Herbalife Nutrition data, I'm not suggesting this is broadly, but perhaps is that these macroeconomic conditions, or I should say, the change is impacting consumer behavior beyond the ability for us to forecast.
Again, we're seeing productivity down, which suggests a reduction in buying behavior, whether that's a swapping out for other goods, whether that's just simply supply – saving dollars for energy purchases and other critical nondiscretionary purchases is unclear at this moment as we're looking through the data.
But clearly, there has been a shift through the quarter and our inability to really forecast these shifts just leads to our inability to forecast how Herbalife Nutrition is going to behave in that environment.
p. 6 · Read in context →
The counter-cyclical case for the model, stated carefully: a weaker labour market can help a push-based income opportunity.
Jeffrey Van Sinderen (B. Riley); Alexander Amezquita (Chief Financial Officer): But overall, just interested to hear if you think you – maybe you have to put some pieces in place for the but do you think you can grow the business in the face of recession? Or do you think that, that's more likely a return to growth or year-over-year growth exiting a recession? […] Jeff, this is Alex. I'll take that one. Good talking with you. So we do believe that we have the ability to grow during a recession. Now obviously, we have to get the right strategic initiatives in place. But we have the history of being able to do something, to grow during recessionary periods. We've referenced a lot on this call about the macroeconomic challenges. And I want to make a distinction between your question and sort of what we're facing.
So currently, these current macroeconomic challenges are still faced with things like a tight labor market, are still faced with a pricing transition that's affecting consumer sentiment. Those are all significant headwinds, obviously, to almost any business. To the extent that you have some stabilization there to the extent even if you have some weakening of the labor market, those sorts of activities could play to our favor.
Historically, our distributors have had the mantra or have had the motivation to get out there and help people find an extra income opportunity at times when they were looking for. So the motivation, our model being a push model where distributors get out there and have certain motivations at time to create that extra sale. Recessionary times, people looking for extra income, those types of – that type of environment actually could benefit us.
And so obviously, we have to see how things play out. There's a lot transitioning in the moment, and it's hard to – that's why we withdrew guidance. It's a little hard to forecast when that might be. But I just want you to simply take away, recessionary times do not necessarily mean that there isn't an opportunity for us to grow. We could potentially grow in those environments, provided we get the right strategies and we get the right motivations out there in the field.
p. 8 · Read in context →
The pandemic-cohort thesis abandoned: newer and tenured distributors were now behaving the same way.
Karru Martinson (Jefferies); Alexander Amezquita (Chief Financial Officer): Last quarter and the quarters before, we talked about there was the pandemic cohort who was not engaging, your longer-term distributors were still putting up good metrics. Is this kind of pulling of guidance now saying that those two groups have kind of merged together? Or is there still a difference between the two groups? […] Karru, great question. Our Q3 results have shown exactly that but those two groups have effectively merged. We're not seeing a material difference from them at this point and the productivity comments that we've made and just generally the trends of pre-pandemic, pandemic, and I'm not quite sure if you say post-pandemic quite yet, but really all cohorts are trending in line.
p. 9 · Read in context →
Asked to separate the June price increase from the macro, management says the data cannot attribute it - an honest limit.
Hale Holden (Barclays); Alexander Amezquita (Chief Financial Officer): My second question was I mean, if I'm just sort of listening between the lines here, it sounds like some of the pricing that you took over the summer, combined with the macro environment, has sort of driven those productivity declines sort of getting worse month, month-to-month through the third quarter. And I was wondering if you thought my comment on the pricing was correct or if it was just something else. […] Well, so we saw the reduction in demand. That's clear and evident in the data. We have our data scientists that run through the performance on a month-to-month basis and we could see the reduction in demand. Now what's challenging is those results, whether it's due to the pricing increase, whether it's due to the macroeconomic conditions, the results are the same. So you can't – it's hard to give attribution to 1 of those 2 things in any sort of – with any sort of specificity.
Further, I think as you go region by region and market, that's going to vary. What's working in the U.S. is probably different in Europe. It's probably different in Asia Pacific, so on and so forth. So I think your comment is generally right. It has had – pricing has had some impact. But to sort of quantify the specific amount of demand elasticity that we've seen in the third quarter, we don't have the data to really suggest with any precision.
p. 11 · Read in context →
More calls
Q3 2025 Earnings Call — Q3 2025 · 11 pages · The return-to-growth quarter, and the only call with quantified Pro2col beta engagement data alongside the case for moving from curated to formulated supplements. · Open →
Q2 2025 Earnings Call — Q2 2025 · 10 pages · Gratziani's first call as CEO - go here for how he framed the mandate before any of the acquisitions had results attached. · Open →
Q1 2025 Earnings Call — Q1 2025 · 13 pages · The CEO handover quarter and the company's first detailed answer on tariff exposure and sourcing. · Open →
Q4 and Full Year 2024 Earnings Call — Q4 FY2024 · 14 pages · Michael Johnson's succession rationale in his own words, plus a restated club conversion figure of 1% to 2% that is lower than the 2023 disclosure. · Open →
Q3 2024 Earnings Call — Q3 2024 · 15 pages · The counterweight to Q2 2024: Michael Johnson says the Latin America price-and-volume-point test "was not well received," and China's first customer loyalty program is quantified. · Open →
Q1 2024 Earnings Call — Q1 2024 · 14 pages · The mechanics of the $1.6 billion senior secured refinancing that removed the 2025 maturity wall, and the restructuring targeted at $80 million of annual savings. · Open →
Q4 and Full Year 2022 Earnings Call — Q4 FY2022 · 15 pages · The quarter after guidance was withdrawn, when management declined to reinstate it and set out what would have to be true first. · Open →
Q2 2022 Earnings Call — Q2 2022 · 14 pages · The 10% global price increase of mid-June 2022 explained at the time, before its effect on volumes became the central question. · Open →
Herbalife Ltd.'s annual reports contain management's most considered account of the business. These are the sections, passages and visual pages worth opening in the originals preserved in Sources.
Herbalife Ltd. — FY2025 Annual Report (Form 10-K) — FY2025
The latest 10-K, and the fullest account of a business where the customer base and the salesforce are the same 6.4 million people. · Open the full document →
Item 1. Business — p. 7 · Read the full section →
The self-description management stands behind: a direct-selling nutrition company whose customers and salesforce are the same people.
Opening description of the company and the direct-selling model.
Herbalife is a global health and wellness company, that, for 46 years, has empowered millions of people to reach their nutrition, health and wellness goals using our science-backed products and the individual coaching provided by our network of independent members. We are the number one active and lifestyle nutrition brand in the world and sell the number one protein shake in the world. We provide weight management, targeted nutrition, energy, sports and fitness, and outer nutrition products in 95 markets around the world.
We use a direct-selling business model to distribute and market our nutrition products to and through a global network of Members. Members include consumers who purchase products for their own personal use and distributors who wish to resell products or build a sales organization.
p. 7 · Read in context →
COMPETITION — p. 9 · Read the full section →
Names the competitor set on both sides — retail nutrition brands and rival direct sellers — and explains the daily-consumption model.
How management says Nutrition Clubs and daily consumption differentiate the business.
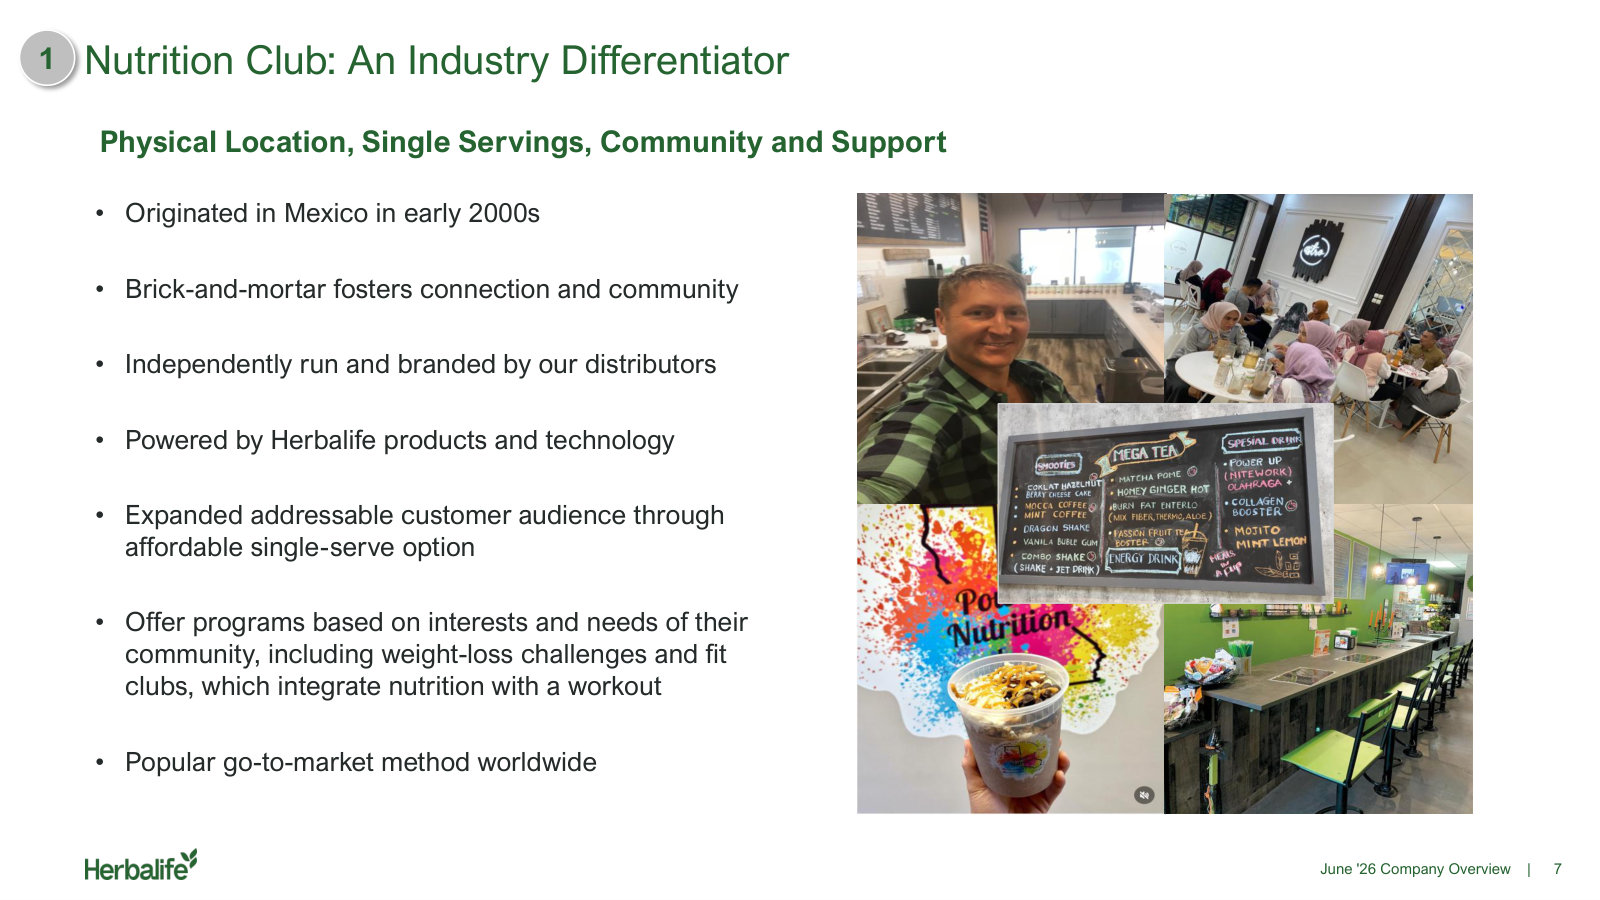
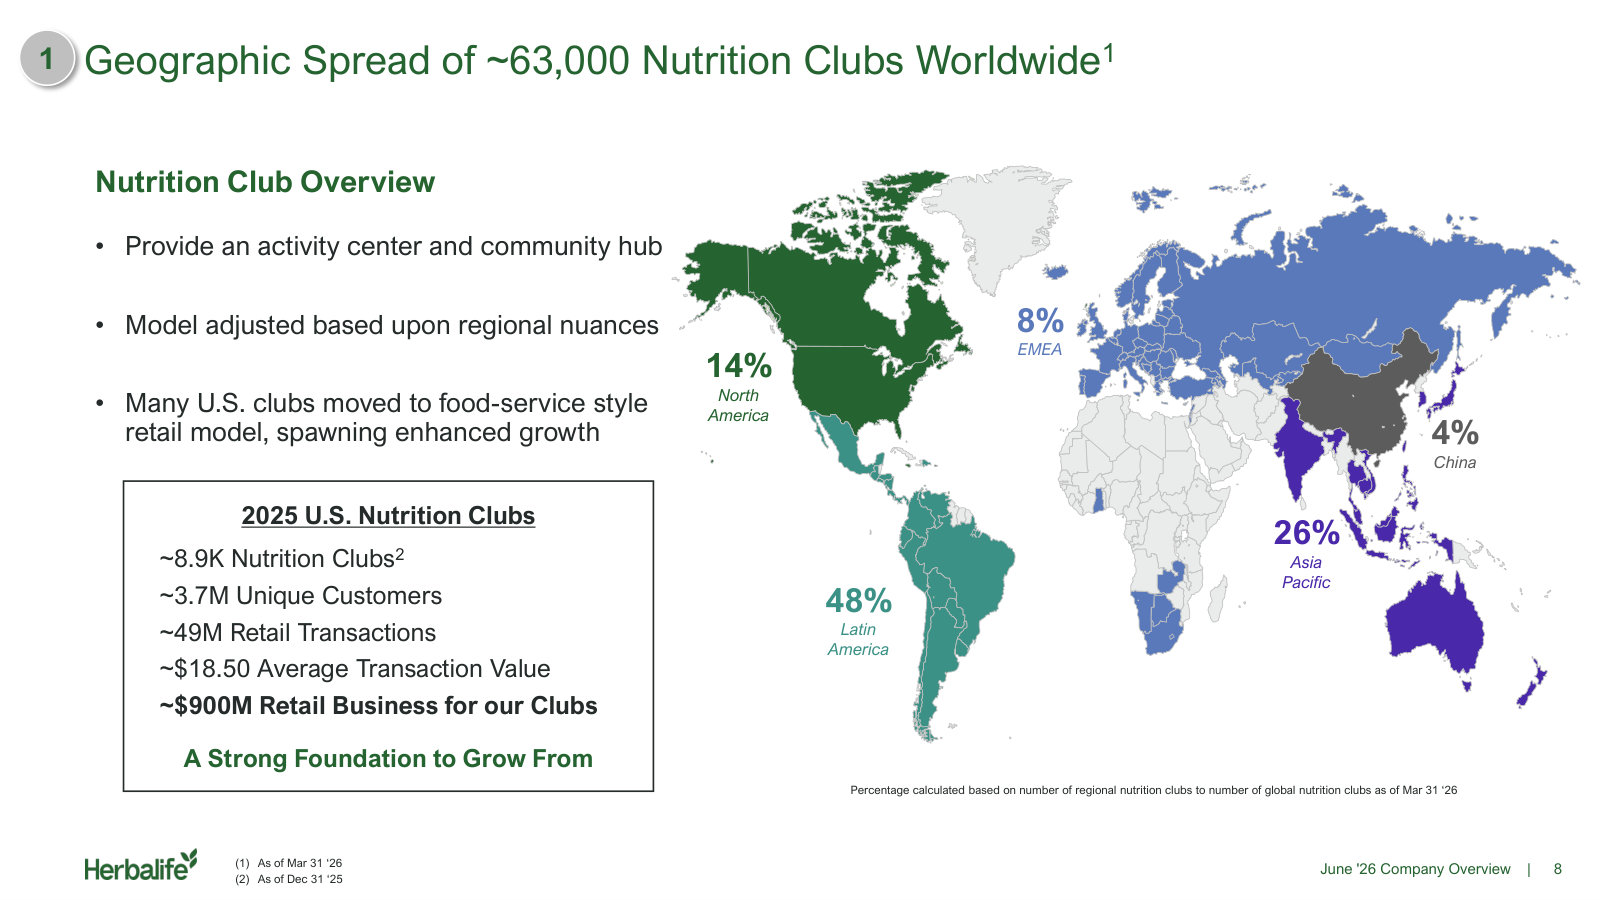
We believe we have differentiated ourselves from our competitors through the innovation of our Members and their focus on “daily consumption” of our products. For example, Members in Mexico developed a sales strategy that became known as “Nutrition Clubs,” which are brick and mortar locations where Members sell prepared, single-serving versions of our products in a setting that also provides a socially supportive community that we believe helps customers achieve their health and wellness goals. Rather than buying a 30-day supply of products, these independently owned and operated businesses allow consumers to purchase and consume our products each day.
p. 9 · Read in context →
OUR NETWORK MARKETING PROGRAM — p. 11 · Read the full section →
Where the revenue model is set out: who the 6.4 million Members are and how much of the retail price is paid away to them.
Member segmentation and counts as of December 31, 2025.
In many of our markets, including our largest markets of United States, India and Mexico, we have segmented our Member base into two categories: “preferred members” – who are consumers who wish to purchase product for their own household use, and “distributors” – who are Members who also wish to resell products or build a sales organization. […] As of December 31, 2025, we had approximately 6.4 million total Members, including 3.1 million preferred members and 2.3 million distributors in the markets where we have established these two categories and 0.2 million sales representatives and independent service providers in China.
p. 11 · Read in context →
Business in China — p. 14 · Read the full section →
China is a separate reporting segment because the model is different — service providers and licences, not multi-level marketing.
Why the China business is structured and reported separately.
Our business model in China includes unique features as compared to our traditional business model in order to ensure compliance with Chinese regulations. As a result, our business model in China differs from that used in other markets. Members in China are categorized differently than those in other markets. In China, we sell our products to and through independent service providers and sales representatives to customers and preferred customers, as well as through Company-operated retail platforms when necessary.
In China, while multi-level marketing is not permitted, direct selling is permitted. Chinese citizens who apply and become Members are referred to as sales representatives.
p. 14 · Read in context →
Our failure to establish and maintain Member and sales leader relationships could negatively impact sales of our products and materially harm our business, financial condition, and operating results. — p. 33 · Read the full section →
The structural risk in the model: all sales run through independents who face no switching cost and turn over heavily.
Dependence on independent Members and the low cost of leaving.
We distribute our products exclusively to and through our independent Members, and we depend on them directly for substantially all of our sales. To increase our revenue, we must increase the number and productivity of our Members. […] In addition, our Member organization has a high turnover rate, which is common in the direct-selling industry, in part because our Members, including our sales leaders, may easily enter and exit our network marketing program without facing a significant investment or loss of capital. For example, the upfront financial cost to become a Member is low, we do not have time or exclusivity requirements, we do not charge for any required training, and, in substantially all jurisdictions, we maintain a buyback program.
p. 33 · Read in context →
Our share price may be adversely affected by third parties who raise allegations about our Company. — p. 46 · Read the full section →
Herbalife names its own history here — the 2012 short campaign is a disclosed, recurring risk rather than a generic market caveat.
The company’s own account of the 2012 short-seller campaign.
Short sellers and others who raise allegations regarding our business activities, some of whom are positioned to profit if our share price declines, can negatively affect our share price. For example, in late 2012, a hedge fund manager publicly raised allegations regarding the legality of our network marketing program, our product safety, our accounting practices, and other matters, and announced that his fund had taken a significant short position regarding our common shares, leading to intense public scrutiny and significant share price volatility. Following this public announcement, our share price dropped significantly.
p. 46 · Read in context →
We are subject to the Consent Order with the FTC, the effects of which, or any failure to comply therewith, could materially harm our business, financial condition, and operating results. — p. 50 · Read the full section →
The 2016 FTC settlement is a live constraint with a numeric trigger that can cap what U.S. distributors are paid.
The 80% test and the 41.75% cap on U.S. distributor compensation.
In addition, the Consent Order provides that if the total eligible U.S. sales on which compensation may be paid falls below 80% of the Company’s total U.S. sales for a given year, compensation payable to distributors on eligible U.S. sales will be capped at 41.75% of the Net Rewardable Sales amount as defined in the Consent Order. Because our business is dependent on our Members, our business operations and net sales could be adversely affected if U.S. distributor compensation is restricted or if any meaningful number of Members are dissatisfied, choose to reduce activity levels, or leave our business altogether.
p. 52 · Read in context →
Presentation — p. 81 · Read the full section →
The MD&A key to reading the P&L: what net sales are net of, and why selling expenses are Member pay rather than marketing.
Definition of selling expenses — Member compensation, the largest operating cost.
Our “selling expenses” primarily consists of certain compensation to our Members. Our sales leader Members may also earn sales commissions and bonuses, which are also considered Member compensation. Globally, excluding China, while certain Members may profit from their activities by reselling our products for amounts greater than the prices they pay us, Members that develop, retain, and manage other Members may earn Member compensation for those activities, which is paid based on retail sales volume of certain other Members who are sponsored directly or indirectly by the Member. This Member compensation is a significant operating expense.
p. 82 · Read in context →
Financial Results for the Year Ended December 31, 2025 Compared to the Year Ended December 31, 2024 — p. 85 · Read the full section →
Management’s own bridge for 2025: growth came from price, not volume, and earnings fell on tax despite better operations.
The 2025 net sales bridge: price up 3.2%, currency down 1.6%, volume down 0.5%.
Net sales were $5,037.5 million for the year ended December 31, 2025. Net sales increased $44.4 million, or 0.9%, for the year ended December 31, 2025 as compared to the same period in 2024. In local currency, net sales increased 2.5% for the year ended December 31, 2025 as compared to the same period in 2024. The 0.9% increase in net sales for the year ended December 31, 2025 was primarily driven by a 3.2% favorable impact of price increases, partially offset by a 1.6% unfavorable impact of fluctuations in foreign currency exchange rates and a 0.5% decrease in sales volume.
p. 85 · Read in context →
The 2025 net income bridge, led by $132.2 million higher income taxes.
Net income attributable to Herbalife was $228.3 million, or $2.20 per diluted share, for the year ended December 31, 2025. Net income attributable to Herbalife decreased $26.0 million, or 10.2%, for the year ended December 31, 2025 as compared to the same period in 2024. The decrease in net income attributable to Herbalife for the year ended December 31, 2025 was mainly due to $132.2 million higher income taxes; partially offset by $61.3 million lower general and administrative expenses driven by lower labor and benefits costs (see General and Administrative Expenses below for further discussion), $34.1 million higher gross profit driven by higher net sales, and $10.5 million loss on extinguishment of debt in 2024 related to the April 2024 debt refinancing transactions (see Liquidity and Capital Resources below for further discussion).
p. 87 · Read in context →
Herbalife Nutrition Ltd. — FY2021 Annual Report (Form 10-K) — FY2021
Included for one section: the Volume Point disclosure management has since retired, at the 2021 peak the company has not revisited. · Open the full document →
Volume Points by Geographic Region — p. 53 · Read the full section →
Volume Points were the volume KPI through 2021; management stopped disclosing them by region, so this is the last clear view of unit trends.
How management defined Volume Points and why it used them as the volume proxy.
A key non-financial measure we focus on is Volume Points on a Royalty Basis, or Volume Points, which is essentially our weighted-average measure of product sales volume. Volume Points, which are unaffected by exchange rates or price changes, are used by management as a proxy for sales trends because in general, excluding the impact of price changes, an increase in Volume Points in a particular geographic region or country indicates an increase in our local currency net sales while a decrease in Volume Points in a particular geographic region or country indicates a decrease in our local currency net sales.
p. 53 · Read in context →
More annual reports
Herbalife Ltd. — FY2024 Annual Report (Form 10-K) — FY2024 · 214 pages · The last edition to disclose Volume Points by region, and the year of the corporate reorganization that drove a large deferred tax benefit. · Open →
Herbalife Ltd. — FY2023 Annual Report (Form 10-K) — FY2023 · 216 pages · First 10-K after the registrant name reverted to Herbalife Ltd., and the last year North America sales leaders stood near 70,000. · Open →
Herbalife Nutrition Ltd. — FY2022 Annual Report (Form 10-K) — FY2022 · 168 pages · Filed under the Herbalife Nutrition name, with the old royalty-override P&L presentation still in place. · Open →
Competitors describe Herbalife Ltd.'s market in their own filings and calls. These verified passages and visual pages show where their strategies meet, using source documents preserved in Sources.
Nu Skin Enterprises, Inc. (NUS)
The closest structural analogue: a global direct-selling company built on independent sales leaders, a premium nutrition and personal-care portfolio, heavy Asia and Mainland China exposure, and a multi-year revenue decline of similar shape. Herbalife names Nu Skin as a direct-selling competitor in its own 10-K, and Nu Skin names Herbalife back.
Nu Skin's 10-K competition discussion puts Herbalife in the three-company set of leading global direct sellers it competes against, and frames the contest as one for sales force and consumers rather than for shelf space.
Leading global direct selling companies include Amway, Natura & Co and Herbalife. We also compete with local direct selling companies in the markets in which we operate. We compete with these companies to attract and retain our sales force and consumers based on the strength of our product offerings, sales compensation, multiple business opportunities, management and international operations.
p. 19 · Read in context →
Nu Skin's own sizing of the nutritional supplements market Herbalife sells into, paired with a Euromonitor-sourced claim to be the world's number one beauty device systems brand and a scan-volume figure it presents as a data moat. Peer-supplied figures, presented as management's framing.
Ryan Napierski — President and CEO: The total addressable market for nutritional supplements reached nearly $500 billion in 2024 and is expected to grow to over $700 billion by 2030 with very little ability to know whether these supplements actually work. Nu Skin is already regarded as the world's #1 beauty device systems brand according to Euromonitor, which is becoming an even greater strategic advantage within the beauty and wellness industries. Additionally, we hold more than 40 years of science-backed research and development in this space and more than 20 years of intelligent wellness research contained in our biophotonics scanner, including insights and trends from the aggregate of 21 million scans for more than 10 million people across more than 50 countries around the world.
p. 2 · Read in context →
Asked how aggressively Nu Skin is pushing into India, management sizes the Indian direct-selling industry and describes a deliberate year-long pre-market entry before formal launch — a peer's read on a market Herbalife already operates in.
Ryan Napierski — President and CEO: The direct selling industry in India is still relatively small — it's just over USD 3.5 billion — so it pales in comparison to some other markets, but it's also the fastest growing. We understand there's a lot of potential there. We also understand there's a lot of room for growth and development in that market before it will see an explosive level of growth, at least for our business model and product categories from an intelligent Beauty and Wellness perspective. So I would say it's very important for us to get it right. The reason we looked at the market in this unique way of a pre-market entry for about a year before we actually open doors for formal launch is precisely for us to learn about how to approach the Indian consumer and the Indian entrepreneur: highly educated, highly ambitious, fairly conservative on discretionary spend and disposable income still, especially in premium spaces. We have a lot to learn on our side as well about how to target them at the right level of spend and benefit. By the way, there's a whole host of learnings that we're gathering out of that. We want to get it right. I think these 12 months or so have been really important for us to dial in manufacturing, quality, logistics and distribution and even product formulas to ensure that they meet the consumer properly, and to align the business model itself. So I would say, as we look forward, we still anticipate low revenue impact in 2026
p. 5 · Read in context →
Medifast, Inc. (OPTAVIA) (MED)
The purest available read on what GLP-1 medications have done to coach-led weight management. Medifast sells meal replacements through independent coaches — Herbalife's model and core category — and Herbalife names it as a direct-selling competitor. Its disclosures show the sales-force and revenue consequences in unusually stark form.
Medifast's 10-K defines the shared weight-management market and explicitly classes GLP-1 medications as a major competitor, while arguing the drugs can be folded into a coached lifestyle program rather than displacing it.
The metabolic health and weight loss industry is very competitive and encompasses a multitude of metabolic health and weight loss products and programs. These include a wide variety of commercial metabolic health and weight loss programs, medications, pharmaceutical products, surgical interventions, books, self-help diets, dietary meal replacements, and appetite suppressants as well as digital tools, app-based health and wellness monitoring solutions, and wearable trackers. The metabolic health and weight loss market is served by a diverse array of competitors. Potential clients seeking to manage their metabolic health or weight can turn to traditional center-based competitors, online diet-oriented sites, self-directed dieting and self-administered products such as prescription medications, over-the-counter medications and supplements, as well as medically supervised programs. Recently, it became clear that medical weight loss solutions, such as GLP-1 medications, have become an increasingly key component of the overall health and wellness ecosystem, and the recent surging acceptance and popularity of these weight loss medications serve as another major competitor, as these products have prompted a huge change in the way that consumers think about weight loss and lifestyle modification solutions in general. We recognize that these weight loss medications have attracted significant attention from the market and pose a threat to our interactions with our traditional client base. Importantly, the efficacy claims of GLP-1 medications for weight loss are based specifically on their incorporation of lifestyle changes that include a reduced calorie diet and increased physical activity As a result, under Medifast’s offerings, weight loss medications can be an important element that fits into the overall tailored lifestyle plans that also include coaching, community support, nutritionally balanced meals, and exercise.
p. 11 · Read in context →
Medifast's re-sized addressable market after the GLP-1 shock: management restates the opportunity as metabolic health rather than weight loss, citing a survey it commissioned. Peer-supplied figures, presented as management's framing.
Nicholas M. Johnson — President: We believe the market opportunity is massive. More than 90% of U.S. adults are metabolically unhealthy, or in other words, are affected by metabolic dysfunction. Our online survey conducted with KRC Research found that nearly 94% of Americans are concerned about at least one aspect of their metabolic health, 85% believe metabolic dysfunction can be reversed, and 84% view metabolic health as central to overall well-being. Yet despite that concern, 80% of Americans report limited understanding of what it truly means to be metabolically healthy. The combination of concern, belief in reversibility, and low understanding of how to achieve change represents a huge opportunity that our science-backed, coach-guided approach is designed to address.
p. 2 · Read in context →
The sales-force arithmetic behind the repositioning: active earning coaches down roughly 45% year-over-year to about 14,000, attributed in part to GLP-1 adoption, against a 19% gain in revenue per remaining coach.
James P. Maloney — Chief Financial Officer: Revenue for the first quarter was $76 million, a decrease of 34.3% versus the year-earlier period, primarily due to a decrease in the number of active earning coaches. We ended the quarter with approximately 14,000 active earning coaches, a decrease of 44.9% from 2025. This decline was driven in part by the rapid adoption of GLP-1 medications, which continues to impact the traditional weight loss category. It is also reflective of our continued work to build a new coach leadership structure comprised of the most productive executive director organizations. This work resulted in average revenue per active earning coach for the first quarter of $5,432, a year-over-year increase of 19.2%. This growth reaffirms the green shoot we saw during Q4 2025, with coach productivity continuing to increase both year over year and sequentially. The 19% year-over-year gain is the largest increase for any quarter in five years, and the sequential quarterly increase of 16% is the highest in eight years.
p. 4 · Read in context →
USANA Health Sciences, Inc. (USNA)
A direct-selling nutrition company of comparable model and China weighting that Herbalife names as a competitor, and that names Herbalife back as a rival for distributor talent. It is furthest along in the strategic question facing Herbalife: whether a direct seller should become an omni-channel branded nutrition company.
USANA's 10-K competition disclosure: it competes on two fronts — for consumers across retail, e-commerce and direct selling, and for distributor talent against Amway, Herbalife and Nu Skin by name.
Our business through USANA, Hiya, and Rise is very competitive and the barriers to entry are not significant. We compete with manufacturers, distributors, and retailers of nutritional products in many channels, including global direct selling, direct-to consumer, specialty retail stores, wholesale stores, e-commerce businesses such as Amazon, and the internet generally. We also compete with other public and privately owned direct sellers for distributor talent, including for example Amway, Herbalife, and Nu Skin. On both fronts, compared to USANA, Hiya, and Rise, many of our competitors are significantly larger, have a longer operating history, higher visibility and name recognition, and greater financial resources. We compete with these entities by emphasizing the strengths of our business, as described in the "Operating Strengths" section above.
p. 31 · Read in context →
USANA's CEO frames the company's defining story as a move away from single-channel direct selling, and lists the three levers being pulled on the legacy business: a rebuilt compensation plan, faster product launches, and systems modernisation.
Kevin Guest — Chairman and Chief Executive Officer: Our first quarter results reflect USANA Health Sciences, Inc.'s continued and deliberate transformation from a single-channel direct sales business to a diversified omni-channel health and wellness platform. That evolution is the defining story of this company right now, and the progress we are making across our three business segments reinforces our confidence that this strategy will deliver sustained, compounding value over time. In our core nutritional business, we saw sequential improvement in Q1. Net sales of $204 million grew 7% sequentially, driven by active customer growth, particularly in our China market, which benefited from customer acquisition activity around the Lunar New Year. The sequential improvement is encouraging and consistent with our view that the actions we are taking to stabilize the business are beginning to take hold. These actions are organized around three clear priorities. First, we are advancing the rollout of our enhanced brand partner compensation plan, which is designed to strengthen the business opportunity and improve the productivity and retention of our distributor network. Second, we are accelerating new product launches, bringing a robust pipeline of new and upgraded formulations to market. And third, we are accelerating our technology initiatives to modernize our core systems and fundamentally improve how customers experience our brands while driving future cost efficiencies across our IT infrastructure. Taken together, we remain confident that these initiatives will continue to stabilize active customer account and position the core nutritional business for a return to sustainable growth.
p. 1 · Read in context →
The disclosed pace of that channel shift: non-direct-selling brands guided to exceed 20% of net sales, from roughly 1% two years earlier — a quantified precedent for the diversification question at Herbalife.
Kevin Guest — Chairman and Chief Executive Officer: We are reaffirming our full-year 2026 guidance across all metrics, projecting consolidated net sales of $925 million to $1 billion. Omni-channel net sales are on track to represent more than 20% of total net sales this year, up from 16% in 2025 and approximately 1% just two years ago. That trajectory speaks to how quickly our omnichannel platform is taking shape.
p. 2 · Read in context →
Nature's Sunshine Products, Inc. (NATR)
The direct seller of nutritional supplements that is currently growing. It names Herbalife as a competitor for both product sales and independent consultants, and its results are the counter-case to the industry-decline narrative: growth driven by digital, subscription and social commerce layered on top of a consultant network.
Nature's Sunshine's 10-K names Herbalife first among the direct sellers it competes with for both product sales and independent consultants, and sets out what it believes that competition actually turns on.
We compete in the nutritional and personal care industry against companies that sell through retail stores, as well as against other direct selling companies. For example, we compete against manufacturers and retailers of nutritional and personal care products, which are distributed through supermarkets, drug stores, health food stores, vitamin outlets, discount stores and mass market retailers, among others. We compete for product sales and independent consultants with many other direct selling companies, including Herbalife, LifeVantage, Nu Skin and USANA, among others. We believe that the principal components of competition in the direct selling of nutritional and personal care products are consultant expertise and service, product quality and differentiation, price and brand recognition.
p. 7 · Read in context →
Nature's Sunshine's stated digital and subscription metrics for North America — the channel economics a direct seller cites when arguing the consultant model can be grown alongside e-commerce rather than replaced by it.
L. Shane Jones — Chief Financial Officer: Our digital business continues to produce very robust year-over-year growth, increasing 42% in Q1. This was fueled by continued strength in customer acquisition, coupled with robust adoption of our subscription Autoship program, leading to better retention and frequency from returning customers. Similar to the exceptionally strong growth that we have seen over the last several quarters, new digital customers increased 60% in Q1. Likewise, subscription Autoship continued to perform very well in Q1, accounting for 48% of the digital sales coming through our website. As we have highlighted before, continued improvement in this metric is a leading indicator for future growth and profitability, since the lifetime value of customers that utilize subscription Autoship is more than three times higher than other customers.
p. 2 · Read in context →
The company's stated ambition to roughly double revenue, with the first three planks being digital expansion, selective US brick-and-mortar retail, and deeper penetration of existing direct-selling markets — the same three doors open to Herbalife.
Kenneth Romanzi — Chief Executive Officer: To build upon this foundation, we have developed what we call Nature's Sunshine Products, Inc.'s Vision for Growth, with the goals of doubling our sales to $1 billion and to leverage our infrastructure to achieve a 15% EBITDA margin over time. Key elements of our vision for growth plan include: one, continued rapid expansion of our digital business; two, explore distribution in select U.S. brick-and-mortar retail channels, working in a complementary, harmonious manner with our existing business; three, deeper penetration in our direct selling markets.
p. 4 · Read in context →
BellRing Brands, Inc. (Premier Protein) (BRBR)
The company Herbalife lists first among its product competitors. Premier Protein serves the ready-to-drink shake occasion that Herbalife's Formula 1 meal replacement addresses, but through club, mass and e-commerce rather than distributors — making its category disclosures the clearest available sizing of the retail alternative.
BellRing's sizing of the US ready-to-drink shake category and its own share position, with GLP-1 usage cited as a demand driver rather than a threat. Declining legacy brands are identified as the share donors.
Darcy Davenport — President and CEO: Now turning to the category. RTD shakes are one of the fastest-growing CPG categories, fueled by consumer health and wellness trends, functional beverage preferences and GLP-1 usage. Household penetration of 54% highlights a long runway for growth as it trails mature CPG categories, which are often at 80% to 90%. Retailers are leaning into this opportunity, increasing category space, testing higher traffic aisle locations and expanding display space to capture growing consumer demand. The success of this category, which has doubled in retail sales since 2019 to $8.7 billion, has naturally attracted competition. Currently, the two leaders, including Premier Protein, have approximately 50% market share. The other participants include newer insurgent and crossover brands and some declining legacy brands. Of note, legacy brands, which collectively represent approximately 30% of the category, have been meaningful share donors for several years now.
p. 1 · Read in context →
Two quarters later, the same management describes the cost of holding that position: promoted volume at 27% of the category and the first decline in shake spend per household in five years, even with the category still growing.
Darcy Davenport — President and CEO: To illustrate, in Q2, promotional frequency and breadth increased sharply year-over-year as newer brands, particularly smaller entrants, continue to invest aggressively to gain traction. As a result, 27% of RTD shake category volumes were sold on price promotion, up 8 percentage points versus last year and a meaningful step up from Q1. Household penetration in protein shakes continues to grow, with little evidence of consumers shifting spend out of shakes into other protein enhanced products. However, in recent months, we have seen a contraction in RTD shake spend per household marking the first decline in buy rate in 5 years. This reflects an increasingly value-focused consumer with greater reliance on promotions, low-priced brands and valuepriced pack sizes. In short, the category remains strong with RTD shakes up 8%, which is well ahead of the broader food and beverage industry.
p. 1 · Read in context →
The Simply Good Foods Company (SMPL)
Named by Herbalife as a product competitor. Its Atkins brand is the retail weight-management franchise most directly analogous to Herbalife's core proposition, and Simply Good Foods reports it separately — giving a clean, disclosed read on how a branded weight-management portfolio is performing inside a growing nutrition category.
Simply Good Foods sizes category growth against its own decline, with the weight-management brand Atkins down almost a quarter year-over-year. Management's stated read is that the gap is execution, not category.
Joe Scalzo — President and Chief Executive Officer: Net sales declined 6.3% to $357 million. Gross margin declined 390 basis points to 32.5%, and adjusted EBITDA declined 22.5% to $57.2 million. Quest and OWYN net sales grew 1.1% and 3.6% versus prior year respectively, and both brands performed slightly better than we expected. We continue to see encouraging momentum in some parts of the portfolio, particularly Quest chips and milkshakes. Atkins net sales declined 24.6% in the quarter, reflecting continued pressure from declining household penetration as a result of insufficient marketing support behind the brand. Our retail takeaway declined 6.7% during the quarter, essentially unchanged from the second quarter. The purposeful nutrition category grew 10% during the same timeframe. As I have spent more time inside the business, it's becoming increasingly clear to me that our challenges are largely execution-driven rather than category-driven.
p. 1 · Read in context →
Management on what went wrong at Atkins — including messaging that moved away from the brand's core weight-management proposition — and its stated view that a weight-management brand still has a role alongside GLP-1 use.
Joe Scalzo — President and Chief Executive Officer: Total brand household penetration currently stands at 8.5%, down 220 basis points from last year. Consistent with what we said last quarter, there are also broad brand factors we are addressing: Atkins has not received the proper level of marketing support; messaging was less consistent and moved away from the brand's core weight management proposition; and the ability to recruit new consumers weakened, which led to slower velocities. Our focus now is on resetting the retail baseline and managing Atkins in a more disciplined, fact-based manner. Many of our retail partners continue to view Atkins as a relevant brand with a meaningful base of loyal heavy buyers. Importantly, we do not believe Atkins needs to be a different brand. Rather, it needs to become a better executed version of the brand consumers have trusted for decades. We believe that Atkins can play a meaningful role in a GLP-1 world with consumers seeking weight management benefits.
p. 3 · Read in context →
More peer documents
Nu Skin Q4 FY2025 earnings call — Q4 FY2025 · 7 pages · Sets the 2026 strategic priorities against a stated $6.8 trillion wellness opportunity, and concedes the “inherent switching costs” of moving the channel onto a new operating model — the transition Herbalife would face in kind. · Open →
Nu Skin FY2024 Form 10-K — FY2024 · 113 pages · Prior-year competition language plus the sales-force KPI series (Customers, Paid Affiliates, Sales Leaders) by segment, for a multi-year read on direct-selling channel attrition alongside Herbalife’s own Member counts. · Open →
Medifast Q4 FY2025 earnings call — Q4 FY2025 · 7 pages · The call where the metabolic-health repositioning was laid out in full, alongside a CEO succession announcement — the fullest statement of how a coach-led weight-loss model answers GLP-1 disruption. · Open →
Medifast FY2024 Form 10-K — FY2024 · 121 pages · Densest GLP-1 discussion of any peer document, plus the compensation peer group that lists Herbalife alongside USANA, Tupperware and WW International. · Open →
USANA Q4 FY2025 earnings call — Q4 FY2025 · 6 pages · Leadership sets out the priority of evolving USANA’s identity “from a legacy direct selling business to a modern science-driven nutritional products company”, with the field-facing sequencing behind it. · Open →
Nature's Sunshine Q4 FY2025 earnings call — Q4 FY2025 · 7 pages · Management sizes health-supplement market growth and states its own share is only 2–3% even in its strongest markets — a peer’s explicit share arithmetic for the category Herbalife sells into. · Open →
Simply Good Foods Q1 FY2026 earnings call — Q1 FY2026 · 12 pages · Details a pilot clinical study testing the Atkins nutritional approach as a companion for GLP-1 users, including muscle-mass retention data, and how the results are being sold into retailers. · Open →
BellRing FY2025 Form 10-K — FY2025 · 74 pages · BellRing’s own competition and customer-concentration disclosure, including club-channel dependence — the structural difference between selling shakes through a handful of retailers and through a distributor network. · Open →
Source: S&P Capital IQ consensus via Xpressfeed · Generated 2026-07-28.
Herbalife's forward tape is thin — two to three analysts on FY2026 and FY2027, one on FY2028 — and it has been cut at the earnings line: FY2027 normalized EPS consensus sits about 10% below where it stood 180 days ago, while FY2027 revenue drifted up about 2% over the same window. The last 90 days ran the other way, with EPS back up roughly 4% as revenue eased about 1%, and nothing has moved in the past 30 days. The company has still beaten normalized-EPS consensus in seven of the last eight quarters, but the surprise has decayed from 89% to 5%. What the tape does carry is leverage: 2-5% revenue growth translating into 17-23% normalized EPS growth each year through FY2028.
Coverage caution: two to three analysts on the forward years, one on FY2028
FY2026 and FY2027 normalized EPS each carry two estimates; revenue and EBITDA carry three. FY2028 revenue, EBITDA and EPS all come from one analyst, so the low and high there are that analyst's own number. Treat the outer year as one view, not a consensus.
FY2027 EPS consensus is 10% below where it stood 180 days ago; revenue is up 2%
Over the last 90 days the direction reverses — EPS up about 4% while revenue eases about 1% — so part of the 180-day cut has been taken back. Nothing has moved in the past 30 days on either line. Only two analysts carry the FY2027 EPS number, so a single revision moves the mean.
Currency: USD · Scale: money in millions, absolute · Point-in-time consensus; Δ90d is Now versus 90d.
| Metric | FY | 180d | 90d | 30d | Now | Δ90d |
|---|---|---|---|---|---|---|
| EPS (normalized) | FY2027 | $3.49 | $3.03 | $3.15 | $3.15 | +4.0% |
| Revenue | FY2027 | $5.25bn | $5.43bn | $5.37bn | $5.37bn | -1.1% |
Seven normalized-EPS beats in eight quarters, but the surprise has shrunk from 89% to 5%
Current sequences by metric: Revenue: 3 consecutive beats; EPS (normalized): 1 consecutive beat.
Currency: USD · Scale: money in millions, absolute · Consensus is captured before each actual first became effective.
| Quarter | Metric | Consensus | Actual | Surprise | Outcome |
|---|---|---|---|---|---|
| Q1 FY2026 | Revenue | $1.31bn | $1.32bn | +0.2% | Beat |
| Q1 FY2026 | EPS (normalized) | $0.61 | $0.64 | +5.4% | Beat |
| Q4 FY2025 | Revenue | $1.24bn | $1.28bn | +3.1% | Beat |
| Q4 FY2025 | EPS (normalized) | $0.48 | $0.45 | -5.6% | Miss |
| Q3 FY2025 | Revenue | $1.27bn | $1.27bn | +0.6% | Beat |
| Q3 FY2025 | EPS (normalized) | $0.46 | $0.50 | +8.4% | Beat |
| Q2 FY2025 | Revenue | $1.27bn | $1.26bn | -1.0% | Miss |
| Q2 FY2025 | EPS (normalized) | $0.50 | $0.59 | +18.6% | Beat |
| Q1 FY2025 | Revenue | $1.23bn | $1.22bn | -0.3% | Miss |
| Q1 FY2025 | EPS (normalized) | $0.41 | $0.59 | +44.9% | Beat |
| Q4 FY2024 | Revenue | $1.19bn | $1.21bn | +1.1% | Beat |
| Q4 FY2024 | EPS (normalized) | $0.22 | $0.36 | +64.0% | Beat |
| Q3 FY2024 | Revenue | $1.25bn | $1.24bn | -1.0% | Miss |
| Q3 FY2024 | EPS (normalized) | $0.30 | $0.57 | +89.4% | Beat |
| Q2 FY2024 | Revenue | $1.33bn | $1.28bn | -3.6% | Miss |
| Q2 FY2024 | EPS (normalized) | $0.39 | $0.54 | +37.1% | Beat |
Consensus carries heavy operating leverage: 2-5% revenue growth, 17-23% EPS growth to FY2028
EBITDA growth accelerates across the window while revenue growth stays in the low single digits. The FY2028 column is one analyst's model rather than a consensus.
Currency: USD · Scale: money in millions, absolute · YoY uses the prior fiscal year from the feed; analyst count and range use the first displayed period.
| Metric | FY2025A | FY2026E | FY2027E | FY2028E | YoY | Analysts | Low / high |
|---|---|---|---|---|---|---|---|
| Revenue | $5.00bn | $5.24bn | $5.37bn | $5.60bn | — | 4 | $4.99bn / $5.02bn |
| EBITDA | $646.92m | $674.08m | $724.66m | $800.80m | — | 4 | $629.36m / $654.00m |
| EPS (normalized) | $2.16 | $2.56 | $3.15 | $3.69 | — | 3 | $2.12 / $2.20 |
The street clusters within 1% on FY2027 revenue but splits 1.74 to 2.68 on FY2026 GAAP EPS
FY2027 GAAP EPS is similarly wide at 2.55 to 3.10. Revenue and EBITDA are far tighter, which places the disagreement between EBITDA and reported earnings rather than in the top line.
Currency: USD · Scale: money in millions, absolute · Spread/mean is absolute high-low divided by absolute mean.
| Metric | Period | Mean | Low–high | Spread/mean | Analysts |
|---|---|---|---|---|---|
| EPS (GAAP) | FY2026E | $2.23 | $1.74–$2.68 | 42.2% | 3 |
| EPS (GAAP) | FY2027E | $2.83 | $2.55–$3.10 | 19.5% | 3 |
| EBITDA | FY2027E | $724.66m | $704.97m–$735.00m | 4.1% | 3 |
| Revenue | FY2027E | $5.37bn | $5.35bn–$5.41bn | 1.2% | 3 |
Three price targets spanning 9 to 25, and a rating mix with no holds
The mean target of 18.33 sits below the median of 21, pulled down by the single low target of 9. Ratings run two buy, one outperform and one underperform, with no holds or sells. This source carries no current share price, so none of it implies upside.
Currency: USD · Scale: money in millions, absolute · Analyst counts shown explicitly.
| Street view | Reading | Analysts |
|---|---|---|
| Recommendation mix | Buy 2, Outperform 1, Hold 0, Underperform 1, Sell 0 | 4 |
| Consensus score | 2.00 | 4 |
| Target price | mean $18.33; median $21.00; high $25.00; low $9.00 | 3 |
Visible Alpha broker models via S&P Xpressfeed · 3 brokers · 360 line items · freshest revision 2026-07-14.
Only three brokers publish full models on Herbalife, and what they add beyond the headline is not the top line but the balance sheet. On these models revenue compounds in the low single digits while net debt falls from about $1.6bn in FY-2025 to roughly $0.2bn in FY-2028, taking net debt/EBITDA from 2.4x to 0.2x. Gross margin is modeled flat near 77.9%, so the FY-2027 earnings step-up comes from operating leverage and a shrinking interest bill rather than from pricing at the product level. Where the three diverge is not revenue but what that revenue earns.
Three brokers at peak, and the segment and volume lines are one- or two-broker views
Peak coverage in this feed is three brokers and the last consensus update is 2026-07-14. Regional revenue, net debt and free cash flow carry two brokers; the volume-point and price/mix bridge is a single model. Product-category revenue was last revised 2023-08-03 and is excluded from this tab.
Deleveraging is the modeled story: net debt/EBITDA from 2.4x in FY-2025 to 0.2x in FY-2028
Free cash flow steps up in FY-2026 and then holds, and that step-up is what funds the paydown. The interest line is how it reaches EPS. The FY-2028 point rests on two brokers, one of whom has the company in a net cash position by then.
| Line | FY-2025A | FY-2026E | FY-2027E | FY-2028E | YoY | Brokers |
|---|---|---|---|---|---|---|
| Leverage | — | — | — | — | — | — |
| Net debt | $1.60bn | $1.17bn | $712.75m | $201.69m | -26.5% | 2 |
| Net debt / EBITDA, TTM(x) | 2.45 Ratio | 1.71 Ratio | 0.99 Ratio | 0.25 Ratio | -30.3% | 2 |
| Interest expense - Non-operating | $205.36m | $190.44m | $136.32m | $151.60m | -7.3% | 3 |
| Cash generation | — | — | — | — | — | — |
| Free cash flow (FCF) | $281.52m | $459.05m | $460.10m | $511.05m | +63.1% | 2 |
| Free cash flow (FCF) per share($) | $2.72 | $4.27 | $4.31 | $4.80 | +57.0% | 2 |
| FCF margin(%) | 5.6% | 8.8% | 8.5% | 9.1% | +3.1pt | 2 |
Latin America is the modeled growth engine, up 11% in FY-2026 while EMEA is flat
Asia Pacific is the largest region and adds the most dollars, but Latin America compounds fastest in every modeled year. China is the telling negative: revenue falls again in FY-2026 before a modeled recovery, and that line has not been revised since 2026-05-07.
| Line | FY-2025A | FY-2026E | FY-2027E | FY-2028E | YoY | Brokers |
|---|---|---|---|---|---|---|
| Total | — | — | — | — | — | — |
| Total revenue | $4.99bn | $5.24bn | $5.37bn | $5.59bn | +5.0% | 3 |
| Region | — | — | — | — | — | — |
| Total revenue - Latin America | $864.86m | $962.55m | $1.00bn | $1.04bn | +11.3% | 2 |
| Total revenue - Asia Pacific | $1.71bn | $1.86bn | $1.89bn | $1.96bn | +8.7% | 2 |
| Total revenue - North America | $1.04bn | $1.05bn | $1.09bn | $1.13bn | +1.4% | 2 |
| Total revenue - EMEA | $1.10bn | $1.10bn | $1.13bn | $1.16bn | +0.0% | 2 |
| Total revenue - China | $280.41m | $264.21m | $272.16m | $283.02m | -5.8% | 2 |
The modeled top line is price, not volume: 2.7pp of FY-2026 growth is price/mix, 0.8pp volume
Volume points rise about 1% a year while growth ex-FX runs near 3%. For a business whose distributor base sets volume, that gap is the load-bearing assumption. It is also the thinnest evidence on this page: the volume and price/mix bridge comes from a single broker.
| Line | FY-2025A | FY-2026E | FY-2027E | FY-2028E | YoY | Brokers |
|---|---|---|---|---|---|---|
| Volume | — | — | — | — | — | — |
| Total Volume points(M#) | 5.55bn Number | 5.60bn Number | 5.65bn Number | 5.71bn Number | +0.8% | 1 |
| Growth bridge | — | — | — | — | — | — |
| Volume impact(%) | -0.3% | 0.8% | 1.0% | 1.0% | +1.1pt | 1 |
| Price / Mix Impact(%) | 1.9% | 2.7% | 1.9% | 2.0% | +0.8pt | 1 |
| Total growth exl. Fx(%) | 1.6% | 3.5% | 3.0% | 3.7% | +1.8pt | 2 |
| Fx impact(%) | -1.5% | 0.5% | -0.2% | 0.0% | +2.0pt | 2 |
Brokers agree on FY-2027 revenue and split hard on what it earns
| Line | Period | Median | Q1–Q3 | Min–max | Brokers |
|---|---|---|---|---|---|
| Total revenue | FY-2027E | $5.36bn | $5.35bn–$5.39bn | $5.35bn–$5.41bn | 3 |
| EPS Diluted, Applicable to common stockholders, Operating($) | FY-2027E | $3.08 | $2.82–$3.15 | $2.55–$3.23 | 3 |
| Interest expense - Non-operating | FY-2027E | $121.00m | $110.88m–$154.10m | $100.77m–$187.20m | 3 |
| Operating margin(%) | FY-2027E | 10.5% | 10.4%–10.9% | 10.2%–11.3% | 3 |
The margin bend is opex leverage, not gross margin
Gross margin sits near 77.9% in both FY-2025 and FY-2028 with no modeled trend, while OpEx/Sales falls from 67.7% to 66.7% and operating margin rises from 10.2% to 11.2%. The FY-2028 OpEx/Sales point is one broker, so treat the final leg as a single model's view rather than a consensus.
Headline P&L consensus, momentum and beat/miss live in the CapIQ tab.
Source: S&P Capital IQ transcripts via Xpressfeed · latest indexed call 2026-05-06 · generated 2026-07-28.
Latest call digest
Herbalife Ltd., Q1 2026 Earnings Call, May 06, 2026 · 2026-05-06T21:30:00
Q1 2026 call — May 6, 2026. Herbalife cleared both guidance ranges. Net sales of $1.3 billion rose 7.8% year-over-year and 5.4% in constant currency against a 3% to 7% guide, and adjusted EBITDA of $176 million came in above the $155 million to $175 million range. Management called it the third consecutive quarter of year-over-year growth and the strongest since the second quarter of 2021.
Prepared remarks were organised around personalization. The Bioniq acquisition closed April 30 for $55 million of base consideration payable over five years plus up to $95 million contingent; Pro2col was positioned as the operating system tying together Link BioScience, Bioniq and Pruvit; a multi-year repackaging programme began in March and runs to end-2027. The April $1.45 billion refinancing is expected to deliver roughly $45 million of annualised cash interest savings, and a new disclosure — net leverage of 2.1x, with a target below 2x by year-end — sat alongside the existing 2.7x total leverage ratio.
The composition of the beat matters more than the headline. Volume grew 4.1% worldwide, while pricing added about $40 million and FX about $29 million of the roughly $100 million net sales increase. India set a second consecutive record at $275 million, up 32% reported and 39% in local currency, on volume up 37%, following the September 2025 GST rate cut. Outside that, results were mixed: EMEA constant-currency sales fell 6% on an 11% volume decline, North America fell 3% on a 5% volume decline (attributed to severe January-February weather closing distributor-owned clubs and to shipments in transit at quarter end), and China fell 12% reported and 16% in local currency.
Q&A was narrower and more sceptical than the prepared remarks. Analysts asked for evidence of Pro2col adoption and got process description rather than metrics; management confirmed no direct Pro2col revenue is in the 2026 forecast, framing it as upside rather than risk. China was quantified at about 4% of sales with no strategy benefit in the numbers. EMEA weakness went largely unaddressed.
Guidance actually stated: Q2 reported net sales up 1.5% to 5.5% (1% to 5% constant currency) and adjusted EBITDA of $150 million to $170 million; full-year reported net sales up 1.5% to 5.5% and adjusted EBITDA of $675 million to $705 million; India GST net incremental cost of roughly $20 million to $25 million for the year; capital expenditure of $50 million to $80 million plus $35 million to $55 million of capitalised SaaS costs; adjusted effective tax rate around 30%.
Participant coverage from the latest call.
| Group | Participants | Count |
|---|---|---|
| Management | Operator; Erin Banyas — Head of Investor Relations, Herbalife Ltd.; Stephan Gratziani — Chief Executive Officer, Herbalife Ltd.; John DeSimone — Chief Financial Officer, Herbalife Ltd. | 4 |
| Analysts | Chasen Bender — Assistant Vice President, Citigroup Inc., Research Division; Karru Martinson — Analyst, Jefferies LLC, Research Division; Nicholas Sherwood — Research Analyst, Maxim Group LLC, Research Division; John Baumgartner — Former MD & Senior Consumer Equity Research Analyst, Mizuho Securities USA LLC, Research Division; Douglas Lane — Managing Director of Consumer, Water Tower Research LLC | 5 |
Curated latest-call exchanges; one row per analyst topic.
| Analyst | Firm | Topic | What changed in Q&A |
|---|---|---|---|
| Chasen Bender | Citigroup Inc., Research Division | Pro2col beta adoption evidence | Asked directly whether beta distributors are selling more Herbalife product and how long customers stay engaged with the app. The answer described the beta's expansion to ten EMEA markets and the feedback loop with distributors, without adoption, engagement or sales figures. DeSimone added that no direct Pro2col revenue is built into the forecast, so any result is upside rather than risk this year. |
| Chasen Bender | Citigroup Inc., Research Division | India GST tailwind and price elasticity elsewhere | Asked what India growth rate is embedded in guidance for the rest of the year. DeSimone declined to give an India figure, said Q2 through Q4 sales expectations are unchanged from February, and that growth will moderate after the September lapping while momentum continues. He extended the India lesson to price and commission testing in other markets, citing EMEA softness and a volume response to the Mexico price increase. |
| Karru Martinson | Jefferies LLC, Research Division | Higher oil costs and pass-through | Management is absorbing the cost rather than passing it to consumers and has not raised prices for it. Guidance carries only a preliminary estimate and management said the impact is not material to the year. Whether geopolitical disruption shifted ordering patterns was called too soon to tell, though European weakness was acknowledged without a cause attached. |
| Karru Martinson | Jefferies LLC, Research Division | China size and trajectory | DeSimone sized China at about 4% of sales with no meaningful profit contribution, said the market's planned strategies are not in the forecast and will not be until results appear, and described the business as not yet having found its footing. Gratziani pointed to distributors from Greater China entering the market for the first time and roughly 500 looking at building there. |
| Nicholas Sherwood | Maxim Group LLC, Research Division | Pro2col inside nutrition clubs | Asked for feedback from the club channel, which management describes as a consumption-driven business with millions of annual walk-ins. The integration is still being built and was characterised as a major work item at an early stage. |
| Nicholas Sherwood | Maxim Group LLC, Research Division | Preferred member migration to new commerce platform | The migration opened only recently after a small pilot, so management said it is too early to discuss. The one substantive datapoint offered was that subscription uptake on the new commerce platform has been positive; Bioniq in Europe will be the company's first genuine subscription product. |
| John Baumgartner | Mizuho Securities USA LLC, Research Division | EMEA: structural decline or productivity | Asked whether the consistent sales-leader declines in EMEA point to structural weakness in direct selling there or to a productivity problem that price adjustments could fix. The reply discussed how consumer expectations and the product offer must evolve and did not address the sales-leader trend or choose between the two explanations. |
| Douglas Lane | Water Tower Research LLC | Bioniq rollout, branding and Link BioScience timing | Bioniq's personalized vitamin and mineral offer will be essentially the same in Europe and the U.S. subject to regulatory differences, will be sold only through Herbalife distributors, and the brand is being retained with the reveal held for Extravaganza. Link BioScience product was placed in the first quarter of next year, a later date than the mid-2026 personalized-supplement access described on prior calls. |
| Douglas Lane | Water Tower Research LLC | Capital allocation after the refinancing | No change to priorities. The stated first priority remains reducing gross debt to approximately $1.4 billion by the end of 2028, which management said would put net debt below $1 billion. No buyback discussion was offered. |
Theme tracker
Themes are curator-classified across supplied calls.
| Theme | Status | Quarters mentioned | Read-through |
|---|---|---|---|
| Personalized nutrition platform (Pro2col, Link BioScience, Bioniq, Pruvit) | emerged | Q1 2025, Q2 2025, Q3 2025, Q4 2025, Q1 2026 | Absent from calls before April 2025, then the organising idea of every call since. It has also become the dominant Q&A subject. The gap worth watching is that after five quarters it still carries no revenue in company guidance, and the Link BioScience product date has moved from the first half of 2026 to the first quarter of next year. |
| Debt reduction and leverage targets | persisted | Q2 2023, Q3 2023, Q4 2023, Q1 2024, Q2 2024, Q3 2024, Q4 2024, Q1 2025, Q2 2025, Q3 2025, Q4 2025, Q1 2026 | The most consistently delivered theme across the whole history. The target has been reset upward each time it was met: total leverage below 3x by end-2025 (hit in Q1 2025), then $1.4 billion of gross debt by 2028, then the April 2026 refinancing, and now a new net leverage measure with a sub-2x goal for year-end 2026. |
| Distributor recruiting rebuild (Premier League, Mastermind, Flex45) | persisted | Q1 2024, Q2 2024, Q3 2024, Q4 2024, Q1 2025, Q2 2025, Q3 2025, Q4 2025, Q1 2026 | Central to the 2024 story, when reversing twelve quarters of recruiting decline was the headline. Airtime has fallen steadily as the platform story took over, and on the latest call management said the Premier League comparison becomes less relevant going forward — retiring the metric that anchored the recovery narrative. |
| China turnaround | persisted | Q2 2023, Q3 2023, Q4 2023, Q1 2024, Q2 2024, Q3 2024, Q4 2024, Q1 2025, Q3 2025, Q4 2025, Q1 2026 | Recurs on nearly every call, but the framing has weakened rather than improved: a customer loyalty programme and major growth opportunity in 2024, growth deferred to a 2027 event in February 2026, and by May 2026 a market at roughly 4% of sales that management says has not found its footing, with no benefit carried in guidance. |
| Nutrition club conversion from transactional to transformational | persisted | Q4 2023, Q2 2024, Q4 2024, Q1 2025, Q2 2025, Q1 2026 | The 1% to 2% conversion rate of club walk-ins to preferred customers has been described as a large untapped opportunity since 2023. Pro2col was presented in 2025 as the mechanism to raise it; on the latest call the club integration was still described as early. No updated conversion figure has been given. |
| GLP-1 positioning | dropped | Q2 2023, Q3 2023, Q4 2023, Q1 2024, Q3 2025 | A regular subject through early 2024, then largely absent. It resurfaced once in November 2025 as an analyst question, answered with unchanged framing (on-ramp, accompaniment, off-ramp, plus MultiBurn as a non-pharmaceutical alternative), and has not come up in the two calls since. The disappearance of a topic that once dominated the bear case is itself notable. |
| Tariffs | dropped | Q4 2024, Q1 2025, Q2 2025, Q3 2025, Q4 2025 | Featured in guidance commentary on five consecutive calls, always characterised as immaterial after duty drawback. It is absent from the Q1 2026 call, where higher oil prices and the geopolitical environment took its place as the named external variable. One quarter of absence, so this reads as a substitution of risk vocabulary rather than a resolved issue. |
| India GST rate reduction as a demand driver | emerged | Q4 2025, Q1 2026 | New since the September 2025 rate cut and now the single largest swing factor in results. It cuts both ways: it drove record India quarters and the Q1 2026 beat, but the unchanged 18% rate on services created a cost mismatch whose estimated full-year drag rose from about $16 million in February to $20 million to $25 million in May. |
| Subscription revenue | emerged | Q2 2025, Q3 2025, Q1 2026 | Introduced with MultiBurn's automatic monthly option in July 2025 and repeatedly described as a structural gap the company is closing. Still qualitative — no subscriber count, retention rate or revenue contribution has been disclosed in any quarter. |
Guidance ledger
Quotes, calls, and speakers are source-verified; outcomes are curator-classified.
| Verbatim guidance | Call | Speaker | Curator outcome | Outcome note |
|---|---|---|---|---|
| “we further reduced our total leverage ratio to 3.5x as of June 30, with the goal to achieve our target of 3x by the end of 2025, following the repayment of the 2025 bonds” | Herbalife Ltd., Q2 2024 Earnings Call, Jul 31, 2024 · 2024-07-31T21:30:00 | John DeSimone | kept | Total leverage reached 3x as of March 31, 2025, which management described on the Q1 2025 call as reaching the milestone three quarters early. |
| “and we plan to use these cash flows to reduce debt by $1 billion over the next 4-plus years and believe we can accomplish this goal by the end of 2028” | Herbalife Ltd., Q3 2024 Earnings Call, Oct 30, 2024 · 2024-10-30T21:30:00 | John DeSimone | pending | Reaffirmed on every subsequent call. Nearly $540 million of debt had been repaid since the start of 2024 as of the Q1 2026 call; the 2028 target date has not passed. |
| “We expect adjusted EBITDA to be in the range of $600 million to $640 million, while in the range of $670 million to $710 million on a constant currency basis.” | Herbalife Ltd., Q4 2024 Earnings Call, Feb 19, 2025 · 2025-02-19T22:30:00 | John DeSimone | kept | Full year 2025 adjusted EBITDA was $658 million, above this initial reported range. The range was raised at each of the following three calls. |
| “By the end of 2025, we believe we'll have tens of thousands of users on the platform with hundreds of thousands by the end of next year.” | Herbalife Ltd., Q1 2025 Earnings Call, Apr 30, 2025 · 2025-04-30T21:30:00 | Stephan Gratziani | unknown | Later calls disclosed beta participation (just over 7,000 distributors in July 2025, growing to 7,900 by November) and engagement activity, but no platform user total against which this can be checked. |
| “We expect net sales growth in the third quarter of between 0.5% and 4.5% year-over-year, both on a reported and constant currency basis.” | Herbalife Ltd., Q2 2025 Earnings Call, Aug 06, 2025 · 2025-08-06T21:30:00 | John DeSimone | kept | Q3 2025 net sales rose 2.7% reported and 3.2% in constant currency, inside the range on both measures. |
| “We expect adjusted EBITDA for the fourth quarter to be in the range of $144 million to $154 million, while in the range of $154 million to $164 million on a constant currency basis.” | Herbalife Ltd., Q3 2025 Earnings Call, Nov 05, 2025 · 2025-11-05T22:30:00 | John DeSimone | kept | Q4 2025 adjusted EBITDA was $156 million, above the high end of the reported range. |
| “On a reported basis, we expect first quarter net sales growth of 3% to 7% year-over-year, including an approximately 250 basis point tailwind from currency.” | Herbalife Ltd., Q4 2025 Earnings Call, Feb 18, 2026 · 2026-02-18T22:30:00 | John DeSimone | kept | Q1 2026 reported net sales rose 7.8%, above the high end, with FX contributing an approximately 240 basis point tailwind. |
| “We expect full year adjusted EBITDA to be in the range of $675 million to $705 million on both a reported and constant currency basis.” | Herbalife Ltd., Q1 2026 Earnings Call, May 06, 2026 · 2026-05-06T21:30:00 | John DeSimone | pending | Narrowed from the $670 million to $710 million range given in February, with the constant currency midpoint raised. The year is not complete. |
| “we now expect India GST-related net incremental cost to be an approximately $20 million to $25 million headwind to full year adjusted EBITDA and an approximately 40 to 50 basis point headwind to adjusted EBITDA margin” | Herbalife Ltd., Q1 2026 Earnings Call, May 06, 2026 · 2026-05-06T21:30:00 | John DeSimone | pending | Higher than the roughly $16 million net incremental cost described on the February 2026 call, reflecting stronger India volume. The full-year figure is not yet testable. |
| “we are targeting net leverage to be below 2x by the end of '26 and remain on track to reduce outstanding debt to approximately $1.4 billion by the end of 2028” | Herbalife Ltd., Q1 2026 Earnings Call, May 06, 2026 · 2026-05-06T21:30:00 | John DeSimone | pending | Net leverage stood at 2.1x at March 31, 2026, the first quarter this measure was disclosed. Neither target date has passed. |
Q&A pressure map
Question counts and firms are curator tallies; analyst coverage shown above.
| Topic | Questions | Firms | Pressure / response |
|---|---|---|---|
| Pro2col and the personalization acquisitions: what they earn and when | 22 | Citigroup Inc., Research Division, Water Tower Research LLC, Mizuho Securities USA LLC, Research Division, Barclays Bank PLC, Research Division, Maxim Group LLC, Research Division | The dominant line of questioning on all five calls since the April 2025 acquisitions, spanning monetization model, guidance contribution, capital requirement, rollout pace, club integration and product segmentation. Management has answered the strategy questions fully and the economics questions sparingly. The most direct request for evidence — on the latest call, whether beta distributors sell more product and how long customers stay engaged — was met with a description of the beta process rather than adoption data, a step back from the engagement statistics volunteered in November 2025. |
| Debt paydown, leverage and use of excess cash | 13 | Barclays Bank PLC, Research Division, Jefferies LLC, Research Division, BofA Securities, Research Division, Water Tower Research LLC | Persistent across eight calls, and the topic where management has been most specific and most consistent. Buyback questions in November 2025 were answered plainly in the negative, and the answer did not change after the April 2026 refinancing removed the cost-of-debt argument. |
| North America return to growth and nutrition club conversion | 9 | B. Riley Securities, Inc., Research Division, Citigroup Inc., Research Division, BofA Securities, Research Division, Mizuho Securities USA LLC, Research Division, Water Tower Research LLC | Pressed hard through 2024 and early 2025 while the region declined, answered each time with a distributor-funnel rebuild argument and quarter-by-quarter framing. The pressure eased once North America returned to growth in Q3 2025, and the Q1 2026 decline was explained by weather and shipment timing rather than reopening the question. |
| Guidance conservatism and the pattern of beats | 7 | Citigroup Inc., Research Division, D.A. Davidson & Co., Research Division, Mizuho Securities USA LLC, Research Division | Analysts have repeatedly asked why raises lag the beats, why range midpoints move down when trends look better, and — in February 2026 — why margin expansion guidance looks light after eight consecutive quarters of exceeding quarterly guidance. Answers have generally identified a specific offset (FX translation lag on gross profit, the India GST services mismatch) rather than defending the range width. |
| China trajectory | 6 | D.A. Davidson & Co., Research Division, Citigroup Inc., Research Division, Jefferies LLC, Research Division | Raised on most calls since mid-2024, usually because results came in below expectations. Management's answers have consistently paired a long-term opportunity argument with an explicit refusal to put any of it in the forecast, which is unusually candid but leaves analysts without a timeline. |
| India GST tailwind durability | 3 | Citigroup Inc., Research Division, Mizuho Securities USA LLC, Research Division | New in February 2026 and immediately central, since India drove both recent beats. Management has said the tailwind runs until the late-September 2026 lapping and that momentum continues beyond at a more moderate level, but has declined to quantify India growth inside guidance. |
Language shifts
Only language evidence verified against the referenced component is shown.
| Observation | Verbatim evidence | Call ID | Component |
|---|---|---|---|
| The China framing has moved from opportunity language to plain admission of failure to execute. In October 2024 management called China a major growth opportunity being reshaped by a new customer loyalty programme; by May 2026 the CFO sized it at about 4% of sales and said the company has not found its footing, while keeping the long-term opportunity claim. | “We haven't found our footing yet.” | 1992814333 | 17 |
| Management retired the metric that anchored the two-year distributor recovery story, on the same call it cited a 13% two-year stack improvement from it. This is the second such retirement in the history reviewed and both followed the metric becoming harder to read favourably. | “And as we have now moved beyond the 2 year anniversary of the Premier League launch, this metric becomes less relevant going forward.” | 1992814333 | 3 |
| The precedent for that retirement: in February 2025 the company signalled it would stop reporting volume points after market-specific changes made year-over-year comparisons less meaningful. | “In future periods, it is likely we will stop reporting volume points and focus primarily on net sales.” | 1914847455 | 4 |
| The named external risk in guidance changed. Tariffs appeared in guidance commentary on five consecutive calls from February 2025 and are absent from the Q1 2026 call, replaced by oil prices and a volatile geopolitical environment. The hedging construction is identical to the one previously applied to tariffs. | “Our guidance also includes a preliminary estimate of the impact of higher oil prices.” | 1992814333 | 3 |
| The caveat that the strategic acquisitions carry no revenue in guidance has been repeated at every call since April 2025 and is now stated proactively rather than in response to a question. It is consistent and honest, but after five quarters it also means the personalization story remains untested against reported numbers. | “we have not rolled into our forecast any revenue – direct revenue from this” | 1992814333 | 7 |
| Confidence language stepped up in November 2025 and has stayed there. The August 2025 call still qualified progress as taking time to show in sales; from Q3 2025 onward management has used turning-the-corner and fundamentally-stronger constructions, which the subsequent three quarters of growth have so far supported. | “This quarter, we made great progress against our strategy and we're turning the corner.” | 1962738735 | 2 |
Twelve quarters of transcripts show a company that has done what it promised on the balance sheet and, since mid-2025, on the top line. The open question the calls leave is what is driving that growth: the Q1 2026 beat rests heavily on India's GST-driven price cut, on pricing and on currency, while the four acquisitions carrying the equity story still contribute no revenue in the company's own forecast and EMEA volume is falling. Whether India can hold after the September lapping, and whether personalization converts from strategy to revenue, is where the debate now sits.
What Herbalife Is
Herbalife sells nutrition products through 6.4 million independent members in 95 markets. Sales fell 14% from their 2021 peak and adjusted profitability fell 35% before both stabilised; separately, $1.9 billion of share repurchases at roughly $48 a share in 2020 and 2021 left negative book equity and $2.0 billion of debt. The shares are now a $1.3 billion stub inside a $2.8 billion enterprise. Growth returned in 2025 and accelerated in early 2026, but the recruitment end of the network is thinning again outside Asia.
2025 Net Sales ($M)
2025 Adj. EBITDA Margin
Market Cap ($M)
Net Leverage (Mar '26)
Sources: 2025 net sales, adjusted EBITDA margin and net leverage from the June 2026 corporate overview [1]; market capitalisation derived from 103,669,416 shares outstanding at April 29 2026 [2] at the July 27 2026 closing price of $12.18 (company price feed).
What the company sells, and to whom
Herbalife makes powders, shakes, teas and supplements and sells none of them in a shop. Products go to independent members, who buy at a discount to suggested retail price and either consume them, resell them, or build a downline organisation that earns commissions on its own sales. As of December 31, 2025 the company sold 144 product types across 95 markets; weight management — meal-replacement shakes, protein drinks, teas — was 54.5% of net sales, targeted nutrition 30.0%, and energy/sports/fitness 12.2% [3].
The member base is not a sales force in the ordinary sense. Of roughly 6.4 million total members at end-2025, 3.1 million were "preferred members" — consumers who simply buy at a discount — and 2.3 million were distributors, with a further 0.2 million sales representatives and independent service providers in China [4]. The economically consequential layer is much smaller: about 602,700 members worldwide had reached "sales leader" status as of February 2025, down from 620,400 two years earlier [5]. Roughly 63,000 Nutrition Clubs — small member-run storefronts where customers buy single servings — are the physical face of the network, about 8,800 of them in the United States [6].
Geographically the business has rotated hard. Asia Pacific is now the largest region at $1,729.8 million of 2025 net sales, ahead of EMEA at $1,114.4 million and North America at $1,033.0 million; China, once a $629.5 million business in 2021, is $279.1 million [7].
Source: Historical Financial Summary, June 2026 corporate overview presentation [8].
Two regions carried the decline. North American net sales fell 27.7% between 2021 and 2025; China fell 55.7%. Asia Pacific grew 9.1% over the same span and Latin America 7.1%, which is why consolidated sales fell 13.2% rather than collapsing.
Where the money actually goes
Herbalife reports a 77.9% gross margin [9]. That number is not comparable to a packaged-food company's, because the cost of getting product to the consumer sits below the gross-profit line rather than in it. The distribution channel is paid out of "selling expenses": for 2025 the company applied, on a weighted-average basis, roughly 90% of suggested retail price as its billing base, gave discounts of up to 50% for distributor allowances, paid commissions and bonuses totalling up to 22% in aggregate, and allocated about 1% to a further bonus [10].
Stacked up, the economics of a dollar of net sales are stable and thin. Selling expenses — almost entirely member compensation — took 35.4% of sales in 2025, general and administrative costs 33.0%, and what fell through as adjusted EBITDA was 13.1% [11].
Source: Historical Financial Summary, June 2026 corporate overview presentation [12].
Member compensation held between 35% and 38% of sales across five years — that ratio is contractual and, in practice, close to fixed. Administrative costs rose from 28.6% of sales in 2021 to 34.6% in 2024 as revenue fell against a cost base built for a larger company, then came back to 33.0% in 2025. A restructuring programme begun in Q1 2024 and completed at end-2025 delivered roughly $80 million of annual savings for about $76.1 million of cumulative pre-tax cost [13]. That is most of the 2025 margin recovery.
The balance sheet the buybacks built
Herbalife carries negative book equity — a shareholders' deficit of $441.5 million at March 31, 2026 [14]. Share repurchases put it there: the 2020 and 2021 buybacks were recorded as an increase to shareholders' deficit rather than run through earnings [15]. The transaction detail, and what those shares are worth at today's price, is the opening of Pay and Capital Allocation. The company has bought no shares in the open market in 2023, 2024 or 2025 [16], and has paid no dividend since 2014 [17].
What the balance sheet inherited was debt. Scheduled principal at December 31, 2025 was $2,050.0 million, of which $1,710.3 million fell due in 2029, and interest expense for the year was $214.4 million [18]. Against $481.0 million of operating income [19], interest consumed 45 cents of every operating dollar. An April 2024 refinancing had cut borrowings but raised the weighted-average rate [20] — interest expense in 2023 had been $165.9 million [21].
That is the position a second refinancing, completed April 29, 2026, addressed. The stack it left is a Term Loan A, a drawn revolver and $800 million of 7.750% senior secured notes due 2033, and the company puts the annual cash interest saving at roughly $45 million [22]. The terms of that exchange, the covenant package attached to it and what it cost to get out of the old stack are the subject of Debt and Covenants.
Source: Capital Structure, June 2026 corporate overview presentation, maturities as of April 29 2026 [23].
Leverage stood at 2.7 times total and 2.1 times net at March 31, 2026 [24]. With $1,991.1 million of debt and $451.2 million of cash on the March balance sheet [25] and 103.7 million common shares outstanding as of April 29, 2026 [26] at $12.18, the equity is about $1.26 billion of a roughly $2.80 billion enterprise value — 45% of the capital structure. That build is struck on balance-sheet debt; Valuation Arithmetic runs the same ratio on Credit Agreement total debt, the larger of the two measures, and so carries a higher enterprise value and a lower equity share. Against the mid-point of 2026 adjusted EBITDA guidance of $675–705 million [27], that enterprise value is about 4.1 times.
What the shares have done
$100 invested in Herbalife at the end of 2020 was worth $26.83 at the end of 2025. The same $100 in the S&P 500 was worth $196.16, and in the company's chosen peer group $62.22 [28].
Source: Performance Graph, FY2025 Form 10-K, Item 5; comparators are the S&P 500 Index and the company's selected peer group [29].
The intra-period path is wider than the annual marks suggest. On the daily price series, the shares peaked at $61.47 in February 2019, closed at $5.11 on February 12, 2025, and closed at $12.18 on July 27, 2026 — roughly 2.4 times the low and 80% below the peak. Sell-side coverage is thin: consensus estimate data shows four contributing analysts, a 2026 EPS estimate of $2.56 rising to $3.15 for 2027, and a mean target of $18.33.
Where the business stands in mid-2026
2025 revenue grew for the first time since 2021, but the composition matters. Net sales rose 0.9% to $5,037.5 million on a 3.2% favourable price effect, a 1.6% currency drag and a 0.5% decline in sales volume, so the growth came from price rather than units [30].
The reported bottom line for 2025 understates what happened underneath it. Net income attributable to Herbalife fell 10.2% to $228.3 million, but operating income rose 24.7% to $481.0 million and pre-tax income rose 62.4% to $275.1 million [31]. The gap is tax: 2024 carried an $84.9 million income tax benefit, including a large deferred tax asset recognised on a fourth-quarter corporate reorganisation, giving an effective rate of negative 50.1% against 17.2% in 2025 [32]. Cash corroborates the operating direction rather than the EPS line: operating cash flow was $333.3 million against capital expenditure of $80.4 million, so free cash flow of $252.9 million exceeded net income by 11% and equalled about a fifth of the current market capitalisation [33].
The first quarter of 2026 was the first genuinely volume-led quarter in years. Net sales of $1,317.2 million were up 7.8%, and the bridge attributes $50.1 million to volume against $39.6 million to pricing, with $25.6 million of country-mix drag and $29.1 million of currency tailwind [34]. Management raised the floor of full-year guidance to net sales growth of 1.5–5.5% and adjusted EBITDA of $675–705 million against $657.6 million in 2025 [35].
The recruitment data underneath that quarter runs the other way, and it is the strongest fact against reading 2026 as a durable turn. Worldwide new distributor growth was negative 2% year on year in Q1 2026, with North America down 15%, EMEA down 22% and China down 21%; only Asia Pacific grew, at 18%. Recruiting activity fell at every sales-leader rank except the two lowest [36]. Regional net sales tell the same story: North America down 3% and China down 12% in the quarter, against Asia Pacific up 17% [37].
Watch item: the 2026 growth is concentrated. Asia Pacific supplied the volume, the new distributors and most of the regional sales gain, while North America, EMEA and China each shed recruits at a double-digit rate in the first quarter.
My read is that the operating recovery is real but narrow: cost reduction and pricing did the work through 2025, Asia Pacific did it in early 2026, and the network outside Asia has not resumed adding people. Two or three consecutive quarters of positive new-distributor growth in North America and EMEA, alongside volume-led sales growth, would make the case that the base has genuinely stabilised. A return to negative worldwide volume once the currency tailwind fades would not.
One disclosure limitation is worth registering at the outset. Herbalife disclosed Volume Points by geographic region for years — the cleanest available proxy for units moved through the network — and stopped: management concluded the metric had lost its usefulness and no longer publishes it [38]. Regional volume can now only be inferred from the sales bridges and the quarterly recruitment tables.
What this report sets out to answer
Whether Herbalife's return to growth reflects a distributor network that has genuinely stabilised, or price increases and currency covering a base that is still contracting — because with roughly $1.5 billion of net debt against a $1.3 billion market capitalisation, the equity is a leveraged claim on the answer.
The bar the retention rate is measured against
Reported sales-leader retention has risen 2.4 points since the January 2021 cycle, to 70.3%, while the last time Herbalife quantified the effect of its lowered re-qualification thresholds the gap was 8.2 points — 68.9% reported against 60.7% adjusted — and every filing since FY2021 has said the lower-threshold method was extended to more markets without restating the adjustment. [1] [2] [3]
The two figures are not the same size. At 8.2 points, the last disclosed effect of the lower thresholds is 3.4 times the 2.4-point gain in the reported rate that management's training programmes are credited with. The FY2021 Form 10-K is the only filing that put both bases side by side: certain markets had adopted a lower re-qualification volume threshold, and "excluding the impact of the lower re-qualification thresholds, the retention rates for 2022 and 2021 would have been 60.7% and 62.9%, respectively," against reported figures of 68.9% and 67.9% [4]. On the adjusted basis the January 2022 cycle fell 2.2 points; on the reported basis it rose 1.0 point, and was described on the February 2022 call as "a record 68.9% of our sales leaders were retained, up from last year's prior record of 67.9%" [5]. One cycle, moving in opposite directions on the two bases.
From the FY2022 Form 10-K onward that adjustment is no longer quantified. Each filing since states that "in recent years certain markets have allowed Members to utilize a lower re-qualification volume threshold and the Company has continued to expand this lower re-qualification method to additional markets," without disclosing the effect [6] [7], and each has carried the same sentence that management "continues to evaluate the importance of sales leader retention rate information" [8] [9]. Management has attributed the improvement to its own initiatives, telling the February 2025 call that training programmes "supported an increase in sales leader retention which grew from 68.3% last year to 70.3% this year" [10].
Sources: sales leader retention rate tables, FY2021 Form 10-K [11], FY2023 Form 10-K [12], FY2025 Form 10-K [13]. Year label is the February in which the rate was applied.
The headcount series is not measured against a threshold the company sets. Sales leaders outside China numbered 582,107 at the end of February 2023 and 580,617 at the end of February 2025 [14], a fall of 0.3% across two cycles in which the reported ex-China retention rate rose 2.7 points, from 67.6% to 70.3% [15].
Three facts in the same disclosure sit against that reading. The ex-China leader count rose 1.6% in the most recent completed cycle, from 571,245 in February 2024 to 580,617 in February 2025 [16]. Full-year 2025 new-distributor recruitment was positive in North America (+8%), Latin America (+15%) and EMEA (+5%) [17]. And the other company-set adjustment inside the reported rate — the U.S. "requalification equalization factor" — is described as a correction adopted with the revised business requirements that followed the Consent Order, to align U.S. re-qualification thresholds with those in other markets [18]; that is a comparability measure rather than a lowered bar. A measurement change and a genuine improvement are not alternatives, and the filings support both.
The February 2026 count is the test. Applying the disclosed 70.3% January 2026 retention rate to the February 2025 base of 580,617 implies about 408,174 re-qualified leaders [19] [20]; the February 2026 count in the FY2026 Form 10-K will show what first-time qualifiers added on top of that. A closing ex-China count above roughly 581,000 puts the improvement in headcount, where no threshold definition reaches. A count that falls while the rate holds at 70.3% puts it in the measurement.
The sales-leader rank
Herbalife's sales-leader count has barely moved in four years, but the people in it have almost entirely changed. Across the four re-qualification cycles from February 2021 to February 2025, roughly 741,000 members newly reached sales-leader rank and roughly 719,000 left it, to move a standing base of about 580,000 by 22,121. Gross movement through the rank runs at more than thirty times the net change in it.
Sales leaders are the part of the member base that matters financially. Of approximately 6.4 million members at the end of 2025 — 3.1 million preferred members, 2.3 million distributors, and 0.2 million sales representatives and service providers in China [21] — only about 580,600 outside China held sales-leader status after the February 2025 re-qualification [22]. These are the members eligible for commissions and bonuses on their teams' sales; everyone else is, in the company's own words, "generally considered discount buyers or small retailers" [23].
Each February, Herbalife demotes sales leaders who failed to meet the preceding twelve months' thresholds. New sales leaders — those who qualified after the prior January — are exempt from that year's re-qualification [24]. That rule makes the disclosed data decomposable: the retention rate applied to the prior February's count gives the number who survived, and the residual against the new February count is the number who reached the rank for the first time.
Turnover inside the sales-leader rank
First-time sales leaders, 4 cycles
Sales leaders lost, 4 cycles
Net change in standing count
Source: derived from disclosed sales-leader counts and re-qualification rates, February 2021 to February 2025, FY2021 [25], FY2022 [26], FY2024 [27] and FY2025 [28] Form 10-Ks; excludes China.
The cycle-by-cycle arithmetic is below. Opening count is the prior February's total sales leaders excluding China; the retention rate is the figure Herbalife discloses for the twelve months ended that January.
Source: derived from sales-leader counts and retention rates in the FY2021 [29], FY2022 [30], FY2023 [31], FY2024 [32] and FY2025 [33] Form 10-Ks.
Roughly 180,000 members reach sales-leader rank in a typical year and roughly the same number fall out of it. The company describes this plainly in its risk factors: "our Member organization has a high turnover rate, which is common in the direct-selling industry, in part because our Members, including our sales leaders, may easily enter and exit our network marketing program without facing a significant investment or loss of capital" [34]. What the disclosure does not do is put the gross flows next to each other, and the gross flows are where the regional divergence shows up.
Where the additions come from
The regional decomposition of the most recent completed cycle, and of the two before it, shows two networks moving in opposite directions under one flat headline.
Source: derived from regional sales-leader counts and regional retention rates, FY2022 [35], FY2023 [36], FY2024 [37] and FY2025 [38] Form 10-Ks.
Asia Pacific supplied about 90,000 first-time sales leaders in each of the three cycles — roughly half of the global total from a region holding 44% of the leader base. North America's first-time qualifiers fell from 13,632 to 8,617, a 37% decline over two cycles, in a region whose retention rate rose over the same span from 69.7% to 75.4% [39] [40]. A rising retention rate on a base with collapsing entry is what survivorship looks like: the leaders who remain are more tenured, and there are fewer of them each year. North America's sales-leader count fell from 95,402 in February 2021 to 52,939 in February 2025, a decline of 44% [41] [42].
Latin America is the one region where entry accelerated: first-time qualifiers rose 42% in the February 2025 cycle, to 33,642, and the regional count turned up from 107,247 to 115,471 [43] [44]. That is one cycle — February 2025 — and the only instance in the disclosed record of a region with a falling leader count turning it up. Whether it repeats is not yet in the filings.
Sources: FY2022 Form 10-K, Number of Sales Leaders [45]; FY2024 Form 10-K [46]; FY2025 Form 10-K [47].
Asia Pacific's share of sales leaders outside China rose from 31.1% in February 2021 to 44.4% in February 2025; North America's fell from 17.1% to 9.1%. China, run under a separate model of service providers and sales representatives, shrank from 68,301 to 22,091 over the same span [48] [49].
Clubs against the leader base
Nutrition Clubs are the capital-committing end of the network: brick-and-mortar locations, developed by Members in Mexico, where Members sell prepared single-serving portions rather than 30-day supplies [50]. A club is a lease and a stock of inventory rather than a rank, so its distribution is a read on network composition that no re-qualification threshold touches. The June 2026 corporate overview puts roughly 63,000 clubs worldwide at 31 March 2026 and gives the geographic spread as Latin America 48%, Asia Pacific 26%, North America 14%, EMEA 8% and China 4% [51].
Against the leader base, the two distributions do not line up. Asia Pacific holds 44% of the sales leaders outside China and 26% of the clubs; Latin America holds roughly 20% of the leaders and 48% of the clubs; EMEA holds 27% of the leaders and 8% of the clubs; North America holds 9% of the leaders and 14% of the clubs. The two bases are not identical — the club shares are of the global total, which includes China at 4%, while the leader shares exclude China — but removing China lifts each remaining club share by about a twenty-fifth and leaves the ordering unchanged. Latin America carries roughly two and a half times the club share its leader share would imply; Asia Pacific, the region supplying about half the global intake of new leaders, carries a little over half of it.
This is one point in time. The corpus holds no club series and no comparable regional split for an earlier date, so what the footprint says about the direction of network composition over time is not answerable from this record.
What each leader carries
Regional net sales divided by the region's February sales-leader count gives a productivity proxy. The four regional lines have moved apart across the period rather than together.
Source: derived from net sales by geographic region — FY2022 Form 10-K [52], FY2024 Form 10-K [53], FY2025 Form 10-K [54] — divided by February sales-leader counts from the same filings.
North America generated $19,514 of net sales per sales leader in 2025 against Asia Pacific's $6,712. The two lines moved apart across the whole period: North America up 30% from 2021, Asia Pacific down 27%. In February 2025, Asia Pacific held 44% of the sales leaders outside China and produced 36% of the net sales; North America held 9% and produced 22%.
A large part of that gap is price level, not effort. Herbalife's Asia Pacific markets — India, Vietnam, Indonesia — carry local price points a fraction of U.S. suggested retail, so a leader selling the same volume books far fewer dollars. The company does not disclose contribution margin below the level of its Primary Reporting Segment, so the gap cannot be resolved into a profitability comparison from the filings. What the series does establish is directional: the marginal sales leader Herbalife has been adding for four years carries roughly a third of the revenue of the ones it has been losing, and the mix shift has been continuous rather than a single-year artifact.
The pattern also has a precedent inside the company's own record. North America's leader count spiked to 95,402 in February 2021 after the 2020 recruitment surge; the FY2021 10-K attributed that year's regional retention collapse to "the significant increase in sales leaders during the second half of 2020, particularly in the North America region where a number of these first-time sales leaders did not requalify" [55]. Asia Pacific's retention rate, at 69.4% in the January 2026 cycle, remains the second-lowest of the four regions while absorbing half the global intake [56].
A peer running the same model
Nu Skin Enterprises operates in the same channel, "primarily utilizing person-to-person marketing," and reports an equivalent sales-leader tier [57]. Its 2025 disclosure is the natural control for whether Herbalife's network dynamics are company-specific or channel-wide.
Sources: Nu Skin FY2025 Form 10-K, Customers, Paid Affiliates and Sales Leaders table and segment revenue [58]; Herbalife FY2025 Form 10-K, sales-leader counts [59] and net sales by geographic region [60].
Nu Skin ended 2025 with 30,045 sales leaders against 36,912 a year earlier, a 19% decline, alongside a 10% fall in customers and a 14% fall in revenue to $1,485.2 million [61]. Herbalife's most recently disclosed ex-China leader count rose 1.6%, and its 2025 net sales rose 0.9% [62] [63]. The two companies' sales-leader definitions are not comparable in level — Nu Skin's tier is far narrower, at roughly $49,000 of revenue per leader — so only the rates of change are informative. On that basis, the channel is contracting and Herbalife is contracting more slowly than the closest listed comparator. Nu Skin's one growing region, Latin America, grew through a redesigned market model that lifted its sales leaders 25% [64] — the same region where Herbalife's first-time qualifiers jumped 42%.
The read, and what would change it
The network's flat headline count is composition rather than durability. About 180,000 members reach sales-leader rank each year and about the same number leave it, and the replacements sit increasingly in Asia Pacific, where each leader carries roughly a third of the revenue of the North American leaders being lost. The retention rate management points to is measured against a threshold the company sets, so it cannot carry the weight of confirming an underlying improvement on its own.
The strongest fact against this read is the peer comparison and the entry data. Nu Skin lost 19% of its sales leaders and 14% of its revenue in 2025 while Herbalife's leader count and revenue both rose slightly; Herbalife's full-year 2025 new-distributor recruitment was positive in three of its four regions outside China [65]; and North America's re-qualification rate reached 77.8% in the January 2026 cycle, its highest in the disclosed record [66]. A network genuinely failing does not usually produce those three things at once.
What would settle it is the February 2026 sales-leader count, due in the FY2026 Form 10-K, on the test set out at the head of this chapter; North America holding near 53,000 is the regional marker to read inside it. The near-term signal points the other way: Q1 2026 new distributors fell 15% in North America, 22% in EMEA and 21% in China, with Asia Pacific the only region adding recruits [67].
One thing the corpus cannot answer: Herbalife does not disclose, in any filing in this record, what a sales leader actually earns. There is no distribution of member compensation, no median, and no retention curve by tenure or by earnings band. The re-qualification rate is the only durability metric on offer. The economics of the individual distributor — the input that ultimately determines whether 180,000 people a year keep signing up for the rank — remain outside the disclosed record. That gap sits directly under the Business and Balance Sheet case for a network that has stabilised.
One market carries the top line
India was 8.9% of Herbalife's net sales in 2021 and 20.9% in the March 2026 quarter. Everything else, taken together, has shrunk 21.5% over that span. India's step-change arrived in the quarter after the Indian government cut GST on most of the company's products from 18% to 5%, effective 22 September 2025. That tax change lowered Indian shelf prices, carries a recurring cost to Herbalife, and annualises in September 2026.
Where the growth actually is
Herbalife's consolidated net sales fell from $5,802.8 million in 2021 [1] to $5,037.5 million in 2025 [2]. Inside that decline, one market went the other way: India rose from $519.1 million to $889.6 million [3] [4], an increase of $370.5 million, or 71.4%. The rest of the company fell from $5,283.7 million to $4,147.9 million, a decline of $1,135.8 million, or 21.5%; over the shorter 2023–2025 window the same base fell 2.8%, from $4,265.8 million.
Sources: India net sales from the FY2021 [5], FY2022 [6], FY2023 [7], FY2024 [8] and FY2025 [9] Form 10-Ks; rest of company derived as consolidated net sales less India, consolidated figures per the FY2021 [10], FY2023 [11] and FY2025 [12] Form 10-Ks.
The 2025 arithmetic makes the dependence exact. Consolidated net sales rose $44.4 million, or 0.9% [13]. India rose $44.8 million [14]. In local currency the picture is less absolute but still lopsided: consolidated local-currency net sales rose 2.5%, about $124.8 million, of which India's 9.7% gain on an $844.8 million base contributed roughly $81.9 million — two-thirds of the total.
The March 2026 quarter tightened it further. Consolidated net sales were $1,317.2 million, up $95.5 million or 7.8%, and up 5.4% in local currency [15]. India was $275.4 million of that, up $66.1 million reported and up 39.0% in local currency against a $15.5 million currency headwind — an $81.6 million local-currency increase [16]. The company's own bridge puts total local-currency net sales at $1,288.1 million against $1,221.7 million, a $66.4 million increase [17]. India therefore contributed more local-currency growth than the company as a whole produced: outside India, local-currency net sales were roughly $15 million lower than a year earlier, about 1.5% down on a $1,012 million base.
Sources: Q1 2026 Earnings Presentation, Regional Net Sales [18]; regional volume and India detail from the Q1 2026 earnings call [19] [20] and the Q1 FY2026 Form 10-Q [21] [22].
Asia Pacific was the only region with volume growth in the quarter. Latin America's 7% local-currency gain came with volume down 2%, and EMEA's 11% volume decline outweighed its pricing [23]. Within Asia Pacific, India's $81.6 million local-currency increase accounts for roughly 93% of the region's $88 million gain, leaving the rest of Asia Pacific up about 3%.
A tax change with a date on it
India's acceleration is not a gradual trend. Quarterly net sales sat in a $178 million to $226 million band for eleven straight quarters, then stepped to $250.3 million and $275.4 million.
Sources: quarterly India net sales per Form 10-Q filings — Q2 FY2023 [24], Q3 FY2023 [25], Q1 FY2024 [26], Q2 FY2024 [27], Q3 FY2024 [28], Q1 FY2025 [29], Q2 FY2025 [30], Q3 FY2025 [31] and Q1 FY2026 [32]; the first quarter of 2023 derived as the six months ended June 30, 2023 less the June quarter, and fourth-quarter figures derived as full-year net sales less the corresponding nine months, full-year figures per the FY2023 [33], FY2024 [34] and FY2025 [35] Form 10-Ks.
The break coincides with a specific date. Effective 22 September 2025 the Indian government reduced GST rates across multiple sectors, cutting the rate on the majority of Herbalife's products sold to members from 18% to 5% [36]. GST is a pass-through tax collected on top of the company's own price, so the change moved the shelf price without moving what Herbalife realises per unit: a tax-inclusive price falls 11.0% when the rate goes from 18% to 5%, and the corresponding cut in maximum retail price for Indian nutraceuticals was put at about 11.1%, with the government pressing manufacturers to pass the saving through in full.
That is why India's volume and its local-currency net sales move together. Herbalife took no price increase in India during 2025 or the March 2026 quarter — the last was 3.0% in November 2024 [37] [38]. India volume rose 6.8% across 2025, with the tax cut live for only the final fourteen weeks [39], then 36.9% in the March 2026 quarter [40]. Management has been direct about the mechanism: the fourth-quarter record of roughly $250 million was "fueled by stronger demand following the reduction of the goods and services tax rate" [41], and on the March quarter call the CFO put it plainly: "We had effectively a price decrease due to the GST reduction, and that created a lot of momentum" [42].
An 11% consumer price cut associated with a 37% volume response implies demand elasticity around three — high for a nutrition brand, and a useful data point about how the Indian member base actually converts price into units. The company has drawn the same conclusion and intends to test it elsewhere: "there is a lot of opportunity for us to affect volume in the future by modifying price and modifying the commission structure" [43]. The mechanism does not transfer to the rest of the portfolio unchanged. In India the government funded the discount out of tax, leaving Herbalife's gross margin per unit intact; a price cut made by Herbalife in another market would reduce a 77.9% gross margin [44].
What the tax cut costs
The rate cut applies to products, not services. The GST charged on services provided by distributors and on intercompany services stayed at 18%, so the input credits Herbalife used to offset can no longer be absorbed [45]. Three consequences show up in the accounts.
FY2025 GST transition charge, pre-tax ($M)
FY2026 guided GST cost, midpoint ($M)
GST credits carried as an asset, 31 Mar 2026 ($M)
Sources: transition charge per the FY2025 Form 10-K [46]; FY2026 cost guidance of $20–25 million per the Q1 2026 earnings call [47]; recognised credits per the Q1 FY2026 Form 10-Q [48].
First, a one-time write-off. The FY2025 accounts carry an $11.3 million pre-tax ($8.5 million post-tax) transition charge for credits generated before the law changed [49], excluded from adjusted EBITDA [50].
Second, a recurring cost that scales with India's success. In February 2026 management sized the 2026 impact at about $16 million and roughly 30 basis points of margin [51]. Eleven weeks later, "based on India's first quarter sales performance and our outlook for the balance of the year", the estimate rose to $20–25 million and 40–50 basis points [52]. Against full-year adjusted EBITDA guidance of $675–705 million [53], that is roughly 3% to 3.6% of the midpoint, and it grows as India grows. Herbalife has offset part of it in a way that connects directly to the network economics examined in Sales Leader Turnover: it cut the sales commission percentage paid to its distributors, booked in selling expenses [54]. The market Herbalife most depends on for growth is also the one where the payout rate has been reduced.
Third, an asset that is not on the balance sheet. Excess GST input credits have accumulated since the September 2025 amendments, and Herbalife states that it "does not expect to generate sufficient future GST liabilities to utilize all of these GST input credits, and the likelihood of receiving a cash refund for certain credits remains uncertain; accordingly, no asset has been recognized" [55]. Only about $10 million was carried as a current asset at 31 March 2026, up from about $5 million three months earlier, covering the portion judged reasonably assured of refund [56] [57]. The company intends to pursue recovery, possibly through litigation, with the outcome uncertain [58]. This is the conservative treatment — the expense runs through earnings while no receivable is booked — which means the guided $20–25 million is a real drag rather than a reserve that can be released.
The September comparison
Management has set out the sequence itself. The GST tailwind is expected "to continue through September, with momentum extending beyond September although at a more moderate level" [59], and on the anniversary "we will be comping quarters that have the GST impact, so the growth rate will moderate" [60]. Guidance already reflects it: after a 7.8% first quarter, the company guided the June quarter to 1.5% to 5.5% reported growth and the full year to the same range [61].
Consensus for 2026 sits at about $5.24 billion of revenue, roughly $201 million above 2025, from three contributing analysts. Holding India flat at its March-quarter run rate of $275.4 million for four quarters produces $1,101.6 million, or $212 million more than 2025 — more than the entire consensus increase, with no growth assumed anywhere else and none assumed in India beyond the level already achieved.
Following the 18 February 2026 fourth-quarter release, which paired the India record with the Ronaldo and Pro2col announcement [62], the shares rose from $16.54 to $19.57, up 18.3%. Following the 6 May 2026 first-quarter release, which paired a larger India beat with the increase in the GST cost estimate and a full-year range below the quarter's growth rate, the shares fell from $16.44 to $14.49, down 11.9%.
The exposure under the growth
India carries a tax dispute file that is not accrued: $109.7 million in aggregate at 31 March 2026, before interest and penalty adjustments, covering VAT and service tax assessments and five audited Indian income-tax years [63]. The itemisation sits with the rest of the group's assessment file in Consent Order and Claims. The company believes it is more likely than not to prevail and has accrued nothing, and it notes that "the Indian income tax authorities are auditing multiple years and it is uncertain whether additional assessments will be received" [64]. Two of the older assessments have already been won at the Tax Tribunal and appealed by the government to the High Court [65]. Against a market capitalisation near $1.26 billion, the unaccrued Indian file is a number worth carrying.
The disclosure architecture has not caught up with the revenue. China — $279.1 million of 2025 net sales, 5.5% of the total — is a separate reporting segment because it does not meet the criteria for aggregation [66], and it holds dedicated risk factors. India, at $889.6 million, sits inside the Asia Pacific region within the Primary Reporting Segment [67], and across the forty-two pages of Item 1A in the FY2025 Form 10-K, India is named twice — in a list of countries where contract manufacturers are located [68] and in a list of data-privacy statutes [69], neither of them about the market itself. The segmentation is defensible on its stated basis: China runs a different compensation model. The absence of a named India risk factor for a market approaching a fifth of revenue is a gap in the disclosure, and there is no India-level contribution margin anywhere in the corpus, so how profitable this growth is cannot be measured from the filings.
China is also the available base rate for what a concentrated Asian market can do in reverse. China net sales were $809.6 million in 2020 and $629.5 million in 2021 [70]; they were $279.1 million in 2025 [71]. Herbalife attributes the origin of that decline to a government action rather than to competition: the 2019 "100-day review" into the promotion and sale of health products "materially and adversely impacted our business in China in 2019 as Members significantly reduced activities and sales meetings during and following the Review" [72]. Six years later that market has not recovered; it fell a further 16% in local currency in the March 2026 quarter [73]. No comparable action is under way in India, and India's regulatory regime is not China's. The relevance is the shape of the risk, not a prediction: this company's largest market has been reset by a regulator once inside a decade, and India's 20.9% share of first-quarter 2026 net sales already exceeds the 14.6% China represented in 2020, the earliest year this corpus reaches.
What the evidence supports
The 2025–2026 return to growth is, in local-currency terms, mostly an India event — entirely so in the March 2026 quarter — and India's step-change is a government-funded price cut that Herbalife did not pay for and cannot repeat elsewhere without paying for it out of gross margin. The level benefit is durable — the rate "is not anticipated to change from this reduced rate" [74], so Indian shelf prices stay about 11% lower — but the growth-rate benefit annualises in September 2026, and the associated cost, now guided at $20–25 million a year, does not.
The strongest fact against this reading is that the tailwind is not the whole of India's momentum. Management dates the rebuild to distributor leadership training that predates the tax change [75], Asia Pacific new distributors grew 18% in the March quarter [76], and the quarter's ex-India local-currency softness was partly North American weather and shipment timing, without which North American net sales would have been slightly positive [77]. On a full-year basis, ex-India local-currency net sales in 2025 were up roughly 1%, not down.
Three checks would settle it, each a named line in a specific filing. India net sales in the December 2026 Form 10-K management discussion: at or above roughly $275 million for the quarter, the level has held through the anniversary rather than reverting to the pre-cut $210–225 million band. Ex-India local-currency net sales in the same filing, derived from the consolidated local-currency growth rate and the disclosed India local-currency growth rate: positive means the rest of the company has stopped shrinking. And the India GST net incremental cost line in 2027 guidance: a figure still rising with India's sales, against an unchanged treatment of the input credits in the contingencies note, would confirm that the cost side of this trade compounds with the revenue side.
Where the shrinkage actually sits
Weight management is the only one of Herbalife's three largest product lines smaller today than it was in 2019, and the company's own named competitors show why. Protein sold at retail grew about 40% over the two years to 2025; the diet-branded version of the same shelf fell 20%; every direct seller in the set fell further than Herbalife. The evidence does not support GLP-1 drugs shrinking nutrition demand. It supports them shrinking the diet-branded, coach-mediated form of it.
HLF weight management, 2019 to 2025
BellRing shakes, FY2023 to FY2025
Medifast revenue, 2022 to 2025
Sources: Herbalife FY2025 Form 10-K, segment note [1] and FY2021 Form 10-K, segment note [2]; BellRing Brands FY2025 Form 10-K, disaggregated net sales [3]; Medifast FY2025 Form 10-K [4] and FY2024 Form 10-K [5].
Herbalife reports net sales in five product lines. Across the seven years from 2019 to 2025 the company as a whole grew 3.3%, from $4,877.1 million to $5,037.5 million [6] [7]. Inside that flat total, the lines moved in opposite directions. Energy, sports and fitness rose 75.3%, from $352.0 million to $617.1 million. Targeted nutrition rose 18.1%, from $1,278.5 million to $1,509.6 million. Weight management fell 8.8%, from $3,012.5 million to $2,746.7 million — and it is the line that carries 54.5% of net sales, down from 61.8% in 2019 [8] [9].
Source: derived from reported net sales by product line, FY2021 Form 10-K [10] and FY2025 Form 10-K [11]; FY2022 figures from the FY2023 Form 10-K segment note [12].
The picture is not a company in decline with one bright spot. It is a company whose non-weight-management business has grown steadily through the whole period, offset by erosion in the line that defines it. Formula 1, the meal-replacement shake, still accounted for 25% of net sales in 2025, down from 27% in 2021 [13] [14]. Management has begun describing the destination in the same terms: the CEO opened the Q2 2025 call by saying Herbalife is "in motion from our roots as a weight management company to becoming the number one active and lifestyle nutrition brand in the world" [15].
What the filings say about the drugs
Across five annual reports covering 2021 through 2025 — the entire period in which semaglutide moved from a diabetes drug to a mass-market weight-loss product — the term GLP-1 does not appear once in Herbalife's Form 10-K. The competition risk factor does refer to "various prescription drugs, which may rapidly capture a significant share of the market," but that sentence has stood word-for-word in the risk factors since the FY2021 filing [16] [17]. It is pre-existing boilerplate, not an acknowledgment.
The earnings calls do mention the drugs, on a count that rises and then falls back to zero. GLP-1 is mentioned zero times in every call from Q2 2021 through Q1 2023. It appears five times in the Q2 2023 call, where management said the drugs were "getting a lot of headlines" and that "we are watching this trend closely" [18], and twice more in Q3 2023. It peaks at ten mentions in each of the Q4 2023 and Q1 2024 calls; on the Q4 2023 call management ruled out competing directly: "We don't see ourselves in the near future offering a GLP-1 product. We believe that our strength is in the behavioral modification, giving product to people that complements a GLP-1 user on their journey" [19]. It then decays: nothing on the next two calls, a single passing reference in Q4 2024, nothing again until five mentions in Q3 2025 — the last of those being an analyst asking how the thinking had evolved, answered by pointing at MultiBurn, a non-pharmaceutical weight-loss supplement, as "a natural alternative" for those who prefer not to use the drugs [20]. In the two most recent calls, February and May 2026, neither management nor any analyst raised GLP-1 at all.
What did change in the filings is the competitor list. In FY2021 Herbalife named its non-direct-selling competitors as Conagra Brands, Hain Celestial and Post, and its direct-selling competitors as Nu Skin, Tupperware and USANA [21]. In the FY2023 filing that list was rewritten to add BellRing Brands and The Simply Good Foods Company on the retail side and Medifast and Amway on the direct-selling side [22]. By FY2025, Conagra, Post and Tupperware were gone and Nestlé had been added [23]. Herbalife's own view of who it competes with moved from packaged food to branded protein at retail. That list is also the reason the peer test below is a fair one: these are the companies Herbalife names, not a market-cap screen.
The retail control
BellRing Brands and Simply Good Foods sell the same nutrition to the same consumers through grocery, club, mass and e-commerce instead of through a distributor. Both are exposed to exactly the same GLP-1 penetration in exactly the same country. Their numbers over the two years to fiscal 2025 are inconsistent with a demand shock at the category level.
BellRing's net sales rose from $1,666.8 million in fiscal 2023 to $2,316.6 million in fiscal 2025, up 39.0% [24]. Its shakes line alone — the direct product analogue of Formula 1 — rose from $1,320.2 million to $1,892.9 million, up 43.4% [25].
Simply Good Foods splits the test more finely still, because it runs two brands from one platform. Quest, positioned around protein, grew from $682.8 million to $863.6 million, up 26.5%. Atkins, positioned around weight management and low-carbohydrate dieting, fell from $526.8 million to $420.8 million, down 20.1% [26]. The two brands share shelves, buyers, salesforce and the same drugs in the market, and the spread between the protein framing and the diet framing is nearly 47 percentage points.
Herbalife's weight-management line over the same two calendar years fell 3.7%, from $2,851.7 million to $2,746.7 million [27].
The direct-selling control
The same two years run the other way for the channel.
Sources: Herbalife FY2025 Form 10-K [28]; BellRing FY2025 Form 10-K [29]; Simply Good Foods FY2025 Form 10-K [30]; Nu Skin FY2025 Form 10-K [31]; Medifast FY2025 Form 10-K [32]. Fiscal years differ: BellRing ends September, Simply Good Foods ends August, the others December.
Medifast is the closest structural analogue Herbalife has: a coach-mediated, weight-loss-first, direct-selling nutrition business in the United States. Its revenue fell from $1,598.6 million in 2022 to $1,072.1 million in 2023, $602.5 million in 2024 and $385.8 million in 2025 — a 75.9% decline from the peak [33] [34]. Its distributor equivalent went with it: active earning coaches fell from 27,100 at the end of 2024 to 19,500 in September 2025 and 16,100 at the end of 2025, a series the company says has been declining since the first quarter of 2023 [35].
Medifast is also the peer that tested the partner-with-the-drug strategy in cash. In the fourth quarter of 2023 it bought $10 million of common stock in LifeMD, a virtual primary-care provider, to anchor a telehealth GLP-1 offering [36]. It sold the entire holding in the second quarter of 2025 [37]. Its FY2025 filing now argues the opposite case Herbalife makes on its calls, and in more detail: roughly one-third of GLP-1 users discontinue within six months and up to 74% within a year, and two-thirds of the weight lost is typically regained within twelve months of stopping [38]. Whatever the merit of that argument, it did not stop the decline.
Nu Skin, the other same-model control this report has used (Sales Leader Turnover), fell from $1,969.1 million to $1,485.2 million over the same two years, down 24.6% [39]. Herbalife's total net sales over the same window were essentially unchanged, from $5,062.4 million to $5,037.5 million [40]. Excluding India, the rest of the company fell 2.8% over the same two years, an arithmetic set out in full in India Concentration [41]. Herbalife is the best performer in a contracting channel on the strength of that one market (India Concentration).
The United States, six years on
The United States is where GLP-1 penetration is highest, where retail protein is most available, and where Medifast lost three-quarters of its business. Herbalife's US net sales were $1,002.6 million in 2019, rose to $1,386.7 million in 2021, and were $1,006.4 million in 2025 [42] [43].
Sources: Herbalife FY2021 Form 10-K, segment note [44] and FY2025 Form 10-K, segment note [45]; 2022 from the FY2023 Form 10-K segment note [46].
Six years produced a round trip and no growth, not a collapse: $1,002.6 million in 2019, a peak of $1,386.7 million in 2021, and $1,006.4 million in 2025. That series is consistent with a pandemic bubble unwinding into a stagnant base rather than with the category being taken away. It sits between the retail control, which grew, and Medifast, which lost 76%. The honest reading is that in Herbalife's largest developed market the drugs are one headwind among several rather than the mechanism — and that the network held a base Medifast could not hold.
Two caveats bound that reading. The United States is also the market where the 2016 FTC consent order constrains how volume is recognised — a US Member earns no Volume Points until the product is sold on to a customer at a profit and the sale is documented [47] — so it is not a clean experiment for the channel question either. And Herbalife's own attempt to compete on product has not yet shown up at the country level: MultiBurn launched in North America in July 2025 and management said initial sales were outpacing expectations [48] and that it "significantly contributed to our performance in Q3" [49], yet full-year 2025 US net sales still fell to $1,006.4 million from $1,026.0 million [50].
India, from March 2026
The forward version of this test is not American. On 20 March 2026 the Indian patent on semaglutide expired, and more than forty domestic manufacturers launched generic versions; Natco Pharma priced an injectable at roughly $14 a month, against branded semaglutide at the equivalent of roughly $125 to $190 a month after Novo Nordisk's own pre-expiry price cuts. That is a fresh market fact drawn from press reporting rather than from the filing corpus, and it should be treated as such.
Its relevance is arithmetic. India was $889.6 million of Herbalife's FY2025 net sales, 17.7% of the total [51], a share that rose again in the March 2026 quarter and carried the whole of the company's local-currency growth (India Concentration). The March 2026 quarter closed eleven days after the generics launched, so it contains essentially no exposure. The June 2026 quarter is the first that does.
The comparison should not be overdrawn. India's per-capita income makes even a $14 monthly injectable a different proposition than in the United States, the addressable population for anti-obesity prescriptions there is small relative to Herbalife's customer base, and the American analogue took roughly three years to move Medifast's reported numbers. But the two forces this chapter separates, a drug-driven demand headwind and a channel losing to retail, are both arriving in India, which was 17.7% of FY2025 net sales and carried the whole of the company's local-currency growth, and they arrive alongside the September 2026 GST anniversary.
The read, and what would change it
On the moat question the evidence supports a narrow advantage, and one that is geographically contingent rather than structural. What Herbalife owns is a distributor relationship that keeps customers buying a commodity nutrition product at a price retail undercuts; the value of that relationship is demonstrable where retail protein is thin and prescription weight loss is absent, and thin where they are not. It is not a product advantage: the gap between Quest and Atkins shows the category is being reallocated by brand positioning, not destroyed, and Herbalife's own product line moved the wrong way while its energy-and-fitness line moved the right way. Herbalife's response runs through execution rather than product economics: a faster launch cadence, MultiBurn and Life I/O.
The strongest fact against that read is Herbalife's own resilience relative to its closest structural peer. Its weight-management line fell 3.7% over the two years in which Medifast, running the same model in the same country against the same drugs, lost 64% of its entire business [52] [53]. Something in the network — daily-consumption habit, Nutrition Club community, geographic breadth — holds a base that Medifast's did not.
Two observable things would separate a durable network advantage from a delayed decline. India volume growth holding through 2027 with generic semaglutide freely available would establish that the distributor relationship survives a cheap pharmaceutical substitute, which is the strongest version of the bull case available. India volume rolling over within four quarters of the March 2026 launch, in a company where the rest of the business is already shrinking about 1.5% a year, would settle it the other way. Both are reported quarterly, in the same regional table Herbalife already publishes.
The permission the business runs on
Herbalife's U.S. network is compensated under rules the Federal Trade Commission wrote in 2016 and an injunction a California court entered in 1986. Both are still binding. Against them sit one live class action over whether distributors are employees and $260.2 million of tax assessments across Brazil, India and Mexico — no loss accrued on $243.6 million of that file, and a loss accrued only on a minority portion of the $16.6 million Brazilian federal withholding matter — and $150.8 million of letters of credit and surety bonds outstanding, about $110 million of it posted to keep the Brazilian cases in court.
What the Consent Order actually changed
The July 2016 Consent Order resolved a multi-year FTC investigation and cost $200 million in cash, paid through Herbalife International of America [1]. The money is long spent. The operating terms are permanent, and they apply to one market only.
Every U.S. Member must be categorised as either a preferred member — a customer who buys at a discount for household use and has no right to resell or build a team — or a distributor. Distributors may be paid on three things and nothing else: purchases by preferred members, demonstrated profitable retail sales to end-use customers, and their own personal consumption within allowable limits. Distributors must also meet conditions before signing a lease for their Herbalife business, including leases for Nutrition Clubs [2].
That third clause reaches into the measurement system itself. Outside the United States and China a Member accumulates Volume Points when they buy product from Herbalife. In the United States a Member receives no Volume Points for a transaction until the product is sold on to a customer at a profit and the sale is documented [3]. Because the same qualification thresholds would then mean something different in the United States than elsewhere, Herbalife applies a "requalification equalization factor" in the U.S. to bring its thresholds back into line with other markets [4]. The retention series examined in Sales Leader Turnover therefore carries a company-set adjustment in its largest single country, disclosed in one sentence and never quantified. That is what the retention series is worth as a measure of network health. Reported sales-leader retention has risen 2.4 points since the January 2021 cycle, to 70.3%, while the last time Herbalife quantified the effect of its lowered re-qualification thresholds the gap was 8.2 points — 68.9% reported against 60.7% adjusted — and every filing since FY2021 has said the lower-threshold method was extended to more markets without restating the adjustment. [5] [6]
Source: FY2025 Form 10-K, Item 1 Business — Marketing Plan and U.S. FTC Consent Order [7] [8]; Item 1A Risk Factors [9].
The last row is the only term in the order that sets a hard number, and it is the least discussed. If total eligible U.S. sales on which compensation may be paid falls below 80% of Herbalife's total U.S. sales in a year, compensation payable to distributors on eligible U.S. sales is capped at 41.75% of the Net Rewardable Sales amount as defined in the order [10]. Herbalife has never disclosed where the eligible-sales ratio sits. The phrase "eligible U.S. sales" appears in the corpus only inside the risk factor and the historical description of the settlement — there is no reported figure, no trend, and no statement that the threshold has or has not been approached in any year. For a business whose U.S. net sales were $1,006.4 million in 2025 [11], an undisclosed ratio governs the payout rate on a fifth of the company.
Supervision has stepped down. The Consent Order subjected Herbalife to audits by an independent compliance auditor for seven years; that term ended on 28 May 2024, though the FTC keeps the right to inspect records and request compliance reports [12]. The obligations themselves did not expire with the auditor. Herbalife's own summary is that compliance "has impacted, and may continue to impact, our business operations, including our net sales and profitability" [13].
Two pieces of that disclosure have since been retired. The $200 million payment and the full description of the settlement sat in the Contingencies note through the FY2023 10-K and appear in neither the FY2024 nor the FY2025 note [14]. So did the sentence acknowledging that "a number of our Members disagreed with our decision to enter into the Consent Order," which opened the same risk factor through FY2023 and was dropped from FY2024 onward [15]. Neither removal changes an obligation; both reduce what a new reader finds.
An older injunction, and the company's own precedent
A second order predates the FTC by thirty years. A permanent injunction entered in California in October 1986, settling an action brought by the state Attorney General, the State Health Director and the Santa Cruz County District Attorney, restricts advertising claims, prohibits certain recruiting-related investments from Members, and mandates that payments to Members be premised on retail value [16]. Forty years on it is still cited alongside the Consent Order as a live constraint on the compensation model.
Its aftermath is the clearest evidence in the filings for how a legal event reaches the network. Herbalife's own risk factor states that adverse publicity from the 1986 injunction "caused a rapid, substantial loss of Members in the United States and a corresponding reduction in sales beginning in 1985" [17]. The company's own account measures the cost of that episode in members and sales.
Management has referred to the 2016 order on an earnings call once in five years. Across the twenty indexed calls from the second quarter of 2021 to the first quarter of 2026, the phrase "Consent Order" does not appear at all and the FTC is named a single time — by John DeSimone, then President and now Chief Financial Officer, describing the senior distributor cohort as having "been very resilient to things like the implementation of the FTC order and other very unique — Herbalife unique and global situations that were challenging" [18]. That is management's position on the record: the rules were a shock the network absorbed. The words "misclassification," "independent contractor" and "class action" appear in none of the twenty calls.
The employment question
Among the unresolved legal matters, the one bearing most directly on the compensation model is a private suit rather than a regulatory action. On 31 October 2024 Herbalife and certain executive officers were named in a purported class action in Los Angeles County Superior Court, Sarah DeSimone v. Herbalife Ltd. et al., alleging violations of the California Labor Code including misclassification of distributors as independent contractors. An amended complaint filed on 21 February 2025 added claims under the California Private Attorneys General Act. Damages are unspecified; Herbalife says it cannot reasonably estimate a loss and does not believe one is probable, and nothing is accrued [19].
The claim runs at the joint of the model. Herbalife's Item 1 lists "classification by government agencies of our Members as employees of the Company" among the regulated conduct it faces in foreign markets, and notes it is subject in various markets to social-security assessments and severance obligations that constrain what rules and termination criteria it can impose on Members without incurring them [20]. The Consent Order risk factor makes the same point from the other side: Herbalife does not have the level of influence over Members it "would if they were our employees" [21]. The company relies on independent-contractor status both to avoid employment cost and to disclaim control over conduct — and California is the one jurisdiction where a court has been asked to test it. The case is at the pleading stage and no certification ruling is disclosed, so nothing here is quantifiable yet.
The tax file
Away from the network rules sits a payment exposure the balance sheet largely does not carry. At 31 March 2026 Herbalife disclosed $260.2 million of named, live tax assessments in three countries. No loss is accrued on $243.6 million of that file. The exception is the $16.6 million of Brazilian federal withholding assessments on payments to Members, where the company states it "has not accrued a loss for the majority of the assessments" — so a loss is accrued on a minority portion of that one matter [22].
Live assessments ($M), no loss accrued on $243.6M
As a share of market value
Letters of credit and bonds outstanding ($M)
Sources: Q1 FY2026 Form 10-Q, Note 5 Contingencies [23] [24] and Note 4 Long-Term Debt [25]; market value derived from 103,669,416 shares outstanding at 29 April 2026 [26] at the 27 July 2026 close of $12.18.
Source: Q1 FY2026 Form 10-Q, Note 5 Contingencies, Tax Matters, at the 31 March 2026 spot rate [27] [28].
The total is a floor rather than a ceiling. It excludes three Brazilian ICMS assessments appealed in 2015 whose amounts are not stated — only the $12.1 million of surety bonds posted against some of them — and it excludes the $13.6 million of Mexican VAT receivables whose refund the company says may be delayed [29]. It also excludes the São Paulo 2018 assessment of $44.1 million, which closed in Herbalife's favour in August 2025. The India component of $109.7 million is the same file examined in India Concentration; what the consolidated view adds is that India is 42% of a problem Herbalife has in three countries at once.
Holding the cases open costs balance-sheet capacity. At 31 March 2026 Herbalife had $150.8 million of issued but undrawn letters of credit and similar arrangements, of which roughly $45 million was an undrawn letter of credit issued against the revolving credit facility and roughly $65 million was surety bonds, both for the Brazil assessments; a further $15 million letter of credit obtained in November 2024 is fully cash-collateralised and does not consume revolver capacity [30], with $15.2 million of restricted cash sitting behind it [31]. Brazilian tax litigation therefore consumes about $45 million of the revolver that the minimum-liquidity covenant in Debt and Covenants measures against.
The accounting treatment is worth pinning precisely, because the two numbers measure different things and are often conflated. The unaccrued $243.6 million is assessments the company judges either not probable of loss or more likely than not to be won, so no liability is recorded under either loss-contingency or income-tax standards. Separately, Herbalife does carry a recognised balance for uncertain income-tax positions: $45.7 million including interest and penalties at 31 December 2025, against $51.3 million a year earlier and $67.4 million at the end of 2023 [32] [33].
Source: FY2025 Form 10-K, Note 12 Income Taxes, unrecognized tax benefits rollforward [34].
The recognised provision has fallen by a third in two years, driven by reductions for prior-year positions, audit settlements and expiring statutes of limitations [35]. The disclosed dispute file over the same period did not fall.
What has already cleared
The direction of travel on the federal overhang has been toward resolution, and it belongs in the same frame. The deferred prosecution agreement Herbalife entered with the Department of Justice in 2020 over FCPA books-and-records violations in China — the matter that cost $123 million in penalties, disgorgement and prejudgment interest in September 2020 [36] — was dismissed with prejudice in 2024 [37]. The independent compliance auditor's term under the Consent Order ended in May 2024 [38]. In Brazil the largest single assessment closed in the company's favour last August and the 2020 and 2021 years have won at first instance [39]. In India the two oldest income-tax years were won at tribunal [40].
The balance of the exposure
On the evidence, the residual legal exposure is weighted toward rule risk rather than payment risk. The $260.2 million assessment file is a fifth of the equity's market value, but it is slow, spread across three countries, contested at multiple levels, and winning more first-instance decisions than it is losing — and the recognised provision behind it has been falling, not building. The permanent constraints are the ones without a number attached: a compensation formula in the largest single country that Herbalife does not report against its own 80% trigger, a measurement basis that differs there from everywhere else and is reconciled by an undisclosed factor, and an independent-contractor status now under test in California. Herbalife's own filings supply the reason to weight those more heavily than the cash: the last time a court order reached this network, the company records that members left quickly and sales fell [41].
The strongest fact against that read is the United States itself. The Consent Order has governed U.S. compensation since 2016, the independent auditor has been and gone, and U.S. net sales were $1,006.4 million in 2025 against $1,026.0 million in 2024 — a 1.9% decline, in a market where prescription weight-loss drugs and retail protein are both fully present [42]. Ten years of the strictest rules in the network produced erosion, not the 1985 outcome, and the competing explanations examined in Weight Management and GLP-1 mean the rules cannot be assigned the decline on their own.
Three disclosures would move this. A ruling on class certification in DeSimone, which would convert an unquantifiable claim into a bounded one and is the single most likely source of a step-change. Any statement — in a 10-K risk factor or a court filing — locating the eligible-U.S.-sales ratio relative to the 80% trigger, which would tell a reader whether the 41.75% cap is theoretical or near. And an adverse judicial-level decision in São Paulo on the 2013 or 2014 years, the two already lost administratively and now backed by $65 million of bonds, which would convert posted collateral into cash paid and would test whether the remaining Brazilian years follow.
Which EBITDA the ratios are measured on
Herbalife refinanced its secured debt in April 2026 and ended the trade with gross debt about $60 million higher than it began, near $2.10 billion. The ninth amendment to the credit agreement that accompanied it also reset the terms on which leverage is measured and capital may be returned. Every leverage ratio in Herbalife's covenant stack is struck on Credit Agreement EBITDA of $744.0 million for the twelve months to March 2026 — $75.6 million above the company's own adjusted EBITDA of $668.4 million, which itself excludes $36.6 million of FY2025 technology cost while the capitalised remainder of the same $357 million programme amortises inside a depreciation line EBITDA removes by construction — and the 2.49 times ratio that measure produces is what cleared the 3.00:1.00 gate the ninth amendment installed for the restored $400.0 million restricted-payments basket, on a base whose FY2026 India GST mismatch is now guided to cost $20-25 million. [1][2][3][4][5][6]
Herbalife reports leverage of 2.7 times gross and 2.1 times net at March 31, 2026 [7]. Both are computed on Credit Agreement EBITDA, a measure the company discloses and reconciles: for the twelve months to March 2026 it was $744.0 million, against adjusted EBITDA of $668.4 million and unadjusted EBITDA of $617.7 million [8]. The $75.6 million bridge from adjusted EBITDA is mostly share-based compensation ($43.1 million) and inventory write-downs ($20.4 million) [9].
There is a second definitional point that is easier to miss. Both the credit agreement and the notes indenture cap the cash that may be netted against debt at $250.0 million [10][11]. Herbalife held $451.2 million of cash at March 31, 2026 [12]. The net leverage ratio the company began publishing in the first quarter of 2026 nets all of it [13]; the documents net $250.0 million of it. The gap is about a quarter of a turn.
Source: derived from Credit Agreement total debt of $2,044.6 million, cash of $451.2 million and the three earnings measures reconciled in the June 2026 corporate overview [14], with the netting cap from the credit agreement [15].
None of this is misreporting — the covenants genuinely run on Credit Agreement EBITDA, so 2.7 times is the correct number for testing compliance. It matters for a different purpose. A reader comparing Herbalife's leverage to a peer, or capitalising it into a valuation, is looking at something closer to 3.1 times gross and 2.4 times net on the company's own adjusted measure, and 3.3 times gross on unadjusted EBITDA.
The distance between those measures is 0.49 turns. On the same quarter's $2,044.6 million of Credit Agreement total debt [16], net leverage as the documents define it is 2.41 times on Credit Agreement EBITDA, 2.68 times on adjusted EBITDA and 2.90 times on unadjusted EBITDA — the most and the least generous reading of one balance sheet, half a turn apart. The technology add-back carries a price in the equity as well. At the 4.3 times enterprise value to adjusted EBITDA the report carries (Valuation Arithmetic), the $36.6 million of FY2025 technology add-backs is worth roughly $157 million of enterprise value [17], about $1.52 a share against a $12.18 price.
The strongest facts against reading that spread as anything more than a measurement question are on the record. Herbalife discloses and reconciles Credit Agreement EBITDA in full each quarter [18], and every technology add-back sits on its own labelled line — amortisation of SaaS implementation costs, expenses related to the Technology Realignment Program, and digital technology program costs [19]. The binding 4.00:1.00 gross test would need Credit Agreement EBITDA to fall 29%, to about $525.5 million; the worst year of the recent decline, 2023, produced $670.1 million [20], $144.6 million above that breach point. The spread is a measurement fact, not a solvency one.
What the documents now permit
The ninth amendment's restricted-payments basket — the pool from which Herbalife may pay dividends or repurchase shares — was reset from $100.0 million to $400.0 million, plus half of consolidated net income earned from January 1, 2026, replacing an accrual that had been running from April 2024 [21]. The leverage gate for drawing on it was loosened at the same time, from 2.50:1.00 to 3.00:1.00 of pro forma total net leverage [22]. Measured as the agreement defines it — total debt of about $2.10 billion less the $250.0 million of nettable cash, over $744.0 million of Credit Agreement EBITDA — that ratio is about 2.49 times [23]. Herbalife therefore has roughly $400 million of documented capacity to return capital today, against a market capitalisation near $1.26 billion.
That capacity is unused by choice. The board's $1.5 billion repurchase authorisation expired February 9, 2024 with $985.5 million unused, and no shares have been bought in the open market in 2023, 2024, 2025 or the first quarter of 2026 [24][25]. The intention behind that is also on the record. Asked directly on the first-quarter call whether the completed refinancing changed capital allocation priorities, the chief financial officer said it did not: "My number one priority is still to get our gross debt down to $1.4 billion by 2028, which would get our net debt below $1 billion" [26]. The goal was first framed in 2025 as reducing debt by $1 billion between mid-2024 and the end of 2028, with debt repayment named as the primary use of cash after internal investment [27].
What the April 2026 refinancing exchanged
In April 2026 Herbalife swapped $1,165 million of expensive secured debt for $1,225 million of cheaper secured debt. The coupon on its secured notes fell 450 basis points, cash interest falls roughly $45 million a year, and gross debt rose about $60 million. The loan documents behind the trade also quadrupled the basket that permits dividends and buybacks, to $400 million — capacity the company has not used and does not currently plan to.
The transaction had two legs, both closing April 29, 2026. Two wholly owned subsidiaries issued $800 million of 7.750% senior secured notes due May 1, 2033 [28], and a ninth amendment to the 2018 credit agreement replaced the existing facilities with a $225 million Term Loan A and a $425 million revolver, both maturing April 29, 2031 [29]. The proceeds, plus a $200 million draw on the new revolver, repaid the $365 million term loan B and redeemed all $800 million of the 12.250% senior secured notes due 2029 [30][31].
The 12.250% notes were issued in April 2024, alongside a term loan B priced at SOFR plus 6.75% and sold to lenders at a 7.00% discount [32][33]. The term loan carried a weighted-average rate of 11.64% at the end of 2025 [34], and total interest expense reached $214.4 million in 2025 against $481.0 million of operating income [35]. The notes were callable only at 106.125%, so redemption ran to about $853 million, including a $49.0 million call premium and roughly $4 million of accrued interest [36][37].
Redeemed Secured Coupon
New Secured Coupon
Call Premium Paid ($M)
Q2 2026 Charge ($M, est.)
Sources: FY2025 Form 10-K, Note 5 Long-Term Debt [38]; Form 8-K dated April 29 2026 [39]; Q1 FY2026 Form 10-Q, Note 15 [40].
Adding issuance costs of about $15 million on the notes and about $8 million on the facilities [41], the cash cost of the transaction was roughly $72 million against a saving management puts near $45 million a year [42] — a payback under two years. The accounting cost lands separately and sooner: Herbalife has told investors to expect a preliminary loss on extinguishment of approximately $95 million in the second quarter of 2026, being the $49.0 million premium plus the write-off of unamortised discount and issuance costs on both retired instruments [43]. That charge sits below the operating line and outside adjusted EBITDA, but it is the second such write-off in three years.
Sources: FY2025 Form 10-K, Note 5 Long-Term Debt [44][45][46]; Q1 FY2026 Form 10-Q, Note 15 [47]. Balances before are at March 31 2026; after, at April 29 2026.
The $45 million reconciles from the coupons alone. The three fixed-rate instruments cost $139.1 million of cash coupon before the deal and $103.1 million after, a $36.0 million reduction that comes entirely from the secured notes. On the floating leg, the margin on the refinanced $365 million fell 375 basis points, worth $13.7 million, offset by the cost of the extra $60 million borrowed — leaving about $9 million and a total near $45.5 million. The chief financial officer described the same arithmetic on the first-quarter call, citing a 450 basis point coupon reduction and 300 and 375 basis point spread reductions on the revolver and term loan [48].
Set against what the business earns, the change is legible. Cash interest paid in 2025 was $205.7 million on operating cash flow of $333.3 million [49] — the business generated about $539 million before paying its lenders and kept 62% of it. On the post-refinancing coupon run-rate of roughly $137 million, it would keep 75%.
Sources: FY2025 Form 10-K, Consolidated Statements of Income [50]; FY2023 Form 10-K, Consolidated Statements of Income for 2021 and 2022 operating income [51] and Note 5 Long-Term Debt for 2021 and 2022 interest [52].
Interest took 21% of operating income in 2021, 57% in 2024 and 45% in 2025. Applied to 2025's operating income, the post-refinancing cash run-rate would be about 28%.
Where the maturities sit
The maturity profile now runs past 2033 for the secured notes, and the schedule after the refinancing is set out in the opening chapter (Business and Balance Sheet).
The extension applies to the secured notes and the bank facilities. The $277.5 million of 4.25% convertible notes still mature June 15, 2028 and the $600 million of 4.875% senior notes still mature June 1, 2029 [53][54]. The convertibles are not an equity option in any practical sense at present: the conversion price is about $16.98 against a share price of $12.18, and Herbalife must settle the principal in cash regardless [55]. They are a $277.5 million cash obligation dated June 2028.
The 2031 maturity on the Term Loan A and revolver is conditional. The credit agreement pulls it forward to 182 days before the convertibles mature — mid-December 2027 — if more than $250.0 million of those convertibles is still outstanding on that date and either first lien net leverage exceeds 2.00:1.00 or total net leverage exceeds 3.50:1.00; a parallel test applies 182 days before the 2029 senior notes mature if more than $300.0 million of them remains [56][57]. The first limb of each test is already met — $277.5 million and $600 million are both above the thresholds — so the bank maturities turn on the leverage limb. On the numbers below Herbalife sits comfortably inside both, and the amendment loosened them (the convertible test was previously a $100.0 million balance and 1.50:1.00 first lien net leverage) [58]. But the tests are measured on those specific dates, which makes the 2027 and 2028 leverage position a live matter rather than a formality.
Covenant headroom
The Term Loan A and revolver carry three maintenance tests and, for the revolver alone, a minimum liquidity floor: total leverage no higher than 4.00:1.00, first lien net leverage no higher than 2.50:1.00, fixed charge coverage no lower than 2.00:1.00, and liquidity of at least $200.0 million [59][60]. Fixed charge coverage is defined simply as Consolidated EBITDA over cash interest [61], which the lower coupon has made far less demanding.
Source: derived from the covenant levels in the amended credit agreement [62], applied to post-refinancing debt of about $2.10 billion and trailing Credit Agreement EBITDA of $744.0 million [63]; the fixed charge coverage line uses the post-refinancing cash coupon run-rate of about $137 million.
Total leverage is the binding test of the three, and the 29% fall in Credit Agreement EBITDA it would take to reach the 4.00 times limit is set out above. Liquidity is the tightest of the four in relative terms: with $200 million drawn and a $45 million letter of credit outstanding, about $180 million of the revolver was available at closing [64], so the $200 million floor depends on accessible cash rather than the facility alone.
The claim on free cash flow
Getting from about $2.10 billion of gross debt to $1.4 billion means repaying roughly $700 million in the ten quarters from mid-2026 to the end of 2028 — about $280 million a year. Free cash flow in 2025 was $252.9 million [65]; with the interest saving phasing in, something near $290 million is the reasonable run-rate if adjusted EBITDA lands inside the $675–705 million guided for 2026 [66]. The plan is arithmetically achievable and it consumes essentially all of it.
The composition is largely fixed. The $200 million revolver draw, the $277.5 million of convertibles maturing in June 2028 and about $28 million of Term Loan A amortisation account for roughly $505 million of the $700 million. The remaining $195 million or so has to come from voluntarily retiring part of the 4.875% senior notes, which are redeemable at par from June 2026 [67] — and which would also clear the second springing-maturity test if the balance fell below $300.0 million [68].
The read that follows from all of this: the refinancing was a good trade on its own terms and a modest one in aggregate. It reduces the lenders' annual claim on operating income by roughly $45 million and pays for itself inside two years, but it did not deleverage — gross debt rose about $60 million, and the transaction's own costs consumed more than a year of its benefit. For an equity valued at less than half the enterprise, the case is most sensitive to where free cash flow goes rather than to the covenant position, which is loose. Management has committed close to all of it — about $280 million a year against a run-rate near $290 million — to the other side of the capital structure through 2028, so on the current plan the equity is paid by debt falling rather than by cash coming out.
The strongest fact against reading that as a constraint is that the deleveraging is working and compounding. Gross principal has fallen from $2,581.1 million at the end of 2023 to $2,044.6 million at March 2026 [69][70], and if 2026 adjusted EBITDA reaches the guided midpoint, gross leverage falls toward 2.7 times without a dollar of repayment. Debt retired at par today is worth more to the equity than the same cash returned at $12.18 if the operating recovery holds. Two things would change the read. Credit Agreement EBITDA sustained below about $600 million would move the 4.00 times test from remote to within one bad year, and would put both December springing tests in play. A repurchase authorisation announced before gross debt reaches $1.4 billion would say that management has re-read its own priority — and would draw on a basket the April amendment deliberately made four times larger.
What the technology programme cost
Herbalife has spent approximately $357 million of a planned $400 million rebuilding its member-facing technology since 2022. None of that cost has ever reduced adjusted EBITDA: the part capitalised into equipment is amortised inside depreciation and added back, the part capitalised as cloud-software implementation is added back on its own line, and the part expensed outright was added back as programme costs. Over the same years the capital expenditure line halved — which is where most of the recent free-cash-flow improvement came from.
Where $357 million went
The $400 million multi-year Digital Technology Program — Herbalife One — began in 2022 and was described as a rebuild of the member-facing technology platform and web-based member tools [1]. By 31 December 2023 the company had incurred about half the expected implementation cost [2]; by the end of 2024, approximately $330 million [3]; by the end of 2025, approximately $357 million [4].
The spend arrives in two places. Capital expenditure was $159.1 million in 2021 against $116.8 million in 2020 [5], peaked at $164.1 million in 2022 [6], and fell to $80.5 million in 2025 [7]. Separately, the then-CFO told the February 2024 call that the company had "strategically pivoted in 2023 to more SaaS-based arrangements" and capitalised about $35 million of cloud-software implementation costs that sit in other assets rather than in property, plant and equipment — putting total 2023 capital spend at roughly $170 million against roughly $165 million in 2022 [8].
2026 shown at the midpoint of guidance (capex $50M-$80M; cloud-software implementation $35M-$55M). Sources: FY2025 10-K, Consolidated Statements of Cash Flows [9]; Q4 FY2023 call [10]; FY2024 and FY2025 results presentations [11] [12]; Q1 FY2026 10-Q [13]; 2021 and 2022 capital expenditure from the FY2023 10-K, Consolidated Statements of Cash Flows [14].
Total capital spend on that combined basis ran $170 million in 2023, $138 million in 2024 and $105.4 million in 2025 — a real decline, but a shallower one than the capital expenditure line alone shows.
Capital expenditure has also undershot its own guidance in each of the last four years.
Sources: FY2021 [15], FY2022 [16], FY2023 [17], FY2024 [18] and FY2025 [19] Forms 10-K.
The free cash flow arithmetic
Free cash flow was $252.9 million in 2025, against $163.4 million in 2024. This section separates that figure into the operating cash flow it came from and the capital spending it is measured after.
Sources: FY2025 Form 10-K, Consolidated Statements of Cash Flows, for 2023 to 2025 [20]; FY2023 Form 10-K, Consolidated Statements of Cash Flows, for 2021 and 2022 [21]; free cash flow derived as operating cash flow less purchases of property, plant and equipment.
Between 2023 and 2025, free cash flow rose $30.4 million. Operating cash flow over the same two years fell $24.2 million, from $357.5 million to $333.3 million; capital expenditure fell $54.6 million [22]. All of the two-year improvement, and more, came from spending less on capital. The single-year step from 2024 to 2025 is more evenly split: of the $89.5 million gain, $47.9 million came from operating cash flow and $41.6 million from lower capital expenditure. An analyst put the pattern to the CFO on the November 2025 call in exactly those terms — "cash from operations going up, you've got CapEx going down" — and asked whether it created room for buybacks; the answer was that buybacks are not a priority and gross debt of $1.4 billion by 2028 is [23].
Capital spend is now below the depreciation it replaces. Depreciation and amortisation was $121.2 million in 2025, with a further $21.3 million of cloud-software amortisation charged outside that line — $142.5 million of asset consumption against $105.4 million of capitalised spend [24] [25]. The balance sheet shows it: net computer hardware and software fell from $286.0 million to $267.1 million during 2025, and net property, plant and equipment from $460.2 million to $447.7 million [26]. That is arithmetically expected while a freshly built platform amortises on three-to-ten-year lives, and it is not by itself underinvestment. It does mean the capital line has limited room to fall further without shrinking the asset base.
What adjusted EBITDA has not been charged
Herbalife's reconciliation runs from net income to EBITDA, then to adjusted EBITDA. Three separate lines in that second step carry the technology programme.
Technology add-backs are the cloud-software amortisation, digital technology programme costs and Technology Realignment Program lines; other add-backs are the Transformation, Restructuring, India GST, tax-settlement and debt-extinguishment items. Sources: Q4 FY2023 results release [27]; FY2024 [28] and FY2025 [29] results presentations.
In 2025 the three technology lines were cloud-software amortisation of $21.3 million, Technology Realignment Program expenses of $9.1 million and digital technology programme costs of $6.2 million — $36.6 million, or two-thirds of the entire $54.9 million gap between EBITDA of $602.7 million and adjusted EBITDA of $657.6 million [30]. Across 2022 to 2025 the same lines total $135.6 million. On the trailing twelve months to March 2026 they run $35.7 million against adjusted EBITDA of $668.4 million [31].
The remainder of the programme cost never enters the reconciliation at all, because it was capitalised into equipment. That portion began amortising in the first quarter of 2024 and ran approximately $35 million in 2024 and $43 million in 2025 [32] — inside depreciation and amortisation, which EBITDA removes by construction.
Those same lines are what the covenant stack is measured on, and Debt and Covenants traces the effect through the documents. Every leverage ratio in Herbalife's covenant stack is struck on Credit Agreement EBITDA of $744.0 million for the twelve months to March 2026 — $75.6 million above the company's own adjusted EBITDA of $668.4 million, which itself excludes $36.6 million of FY2025 technology cost while the capitalised remainder of the same $357 million programme amortises inside a depreciation line EBITDA removes by construction — and the 2.49 times ratio that measure produces is what cleared the 3.00:1.00 gate the ninth amendment installed for the restored $400.0 million restricted-payments basket, on a base whose FY2026 India GST mismatch is now guided to cost $20-25 million.
2025 Technology Add-Backs ($M)
2025 EBITDA ($M)
2025 Adjusted EBITDA ($M)
Values shown are FY2025, the last row of the bridge above: EBITDA of $602.7 million, technology add-backs of $36.6 million — amortization of SaaS implementation costs, expenses related to the Technology Realignment Program and digital technology program costs — and adjusted EBITDA of $657.6 million. Source: Q4 and FY2025 results presentation [33].
Adjusted EBITDA is the denominator of the trading multiple set out in Valuation Arithmetic, the base from which the Credit Agreement EBITDA in Debt and Covenants is built, and one of the two metrics on which both the annual bonus and the reinstated performance stock units pay, per Pay and Capital Allocation. At the 4.3 times enterprise value to adjusted EBITDA used in Valuation Arithmetic, $36.6 million of technology add-backs is roughly $157 million of enterprise value, or about $1.52 per share against a $12.18 price.
The newest of the three lines is worth naming. The Technology Realignment Program was initiated in April 2025 as a process and organisational redesign of the global technology infrastructure; $11.5 million of pre-tax expense had been incurred through 31 March 2026, all of it employee retention and separation costs [34], against approximately $13 million of expected annual savings from 2026 [35]. The $13 million of expected annual savings exceeds the $11.5 million incurred to date, and 2025 is the fourth consecutive year in which a technology cost has been presented as non-recurring.
What the capital expenditure line now measures
The FY2025 10-K withdrew the separate Herbalife One disclosure: because the company plans to keep investing broadly in digital technology, "it is no longer relevant to separately disclose costs associated with Herbalife One" [36]. The same filing guided 2026 capital expenditure to $50 million to $80 million, and said nothing in that discussion about the cloud-software bucket.
The Q1 2026 10-Q filled the gap. Capitalised implementation costs for cloud-based software applications were $10.0 million in the first quarter of 2026 against $4.7 million a year earlier, recorded in prepaid expenses and other current assets and in other assets, with amortisation charged to general and administrative expenses; full-year 2026 costs of that kind are expected at $35 million to $55 million [37]. The CFO put it plainly on the May 2026 call: those costs "are incremental to CapEx" [38].
The two lines move in opposite directions. First-quarter capital expenditure fell 45%, from $20.0 million to $11.0 million; capitalised cloud-software costs more than doubled, from $4.7 million to $10.0 million [39]. Combined, the two fell 15%, from $24.7 million to $21.0 million — the $11 million and $10 million the May 2026 results deck reports side by side [40].
For the full year, the guided ranges sum to $85 million to $135 million against $105.4 million of combined spend in 2025 — a midpoint of $110 million, slightly above last year. The capital expenditure line alone is guided at $50 million to $80 million against $80.4 million: down 19% at the midpoint and as much as 38% at the low end. Set against guided 2026 adjusted EBITDA of $675 million to $705 million, up $17.4 million to $47.4 million on 2025 [41], the top of the capital range would absorb $29.6 million of that increase.
The read, and what would change it
The evidence points to the 2025 free-cash-flow step-up being the back end of an investment cycle at least as much as an operating improvement: since 2023, free cash flow is up $30.4 million while operating cash flow is down $24.2 million, and the entire difference is lower capital expenditure. On the 2026 guidance, that source of improvement stops — combined capitalised spend of $85 million to $135 million brackets the $105.4 million spent in 2025, with a midpoint slightly above it, and what changes is mainly its allocation between two disclosure lines.
The strongest fact against that read is the first quarter of 2026, when operating cash flow was $113.8 million against $0.2 million a year earlier. Most of it is timing rather than trading: the company attributes $99.0 million of the $113.6 million swing to favourable changes in operating assets and liabilities, mainly employee bonus payments made in the second quarter of 2026 but in the first quarter of 2025, and only $14.6 million to higher net income excluding non-cash items [42]. The $99.0 million reverses in the second quarter.
A second fair objection: a platform rebuild genuinely is a one-time cost, $357 million of the planned $400 million is spent, and combined 2025 capital spend of $105.4 million on $5,037.5 million of net sales is 2.1% — close to the $116.8 million Herbalife spent in 2020, before the programme began [43]. On that reading the company has simply returned to a normal spending level with a rebuilt platform to show for it, and the SaaS line is an accounting consequence of buying cloud licences instead of owning software, not a place to hide money.
Two things would settle it. The first is whether 2026 free cash flow rises on operating cash flow with combined capitalised spend landing near the bottom of the $85 million to $135 million range, rather than on the capital line falling again. The second is whether the technology add-backs shrink: cloud-software amortisation of $20.4 million on the trailing twelve months to March 2026 is running level with the $16 million to $25 million of annual cloud-software spend disclosed for 2024 and 2025, so the add-back should fade unless the 2026 spend guidance of $35 million to $55 million is met at the top of the range. A fifth consecutive year of technology costs presented outside adjusted EBITDA would say the programme is a run-rate, not a project.
One limitation is worth stating. The corpus discloses combined capital spend only from 2023 onward, when the cloud-software split began; the 2021 and 2022 figures in the first chart are capital expenditure alone, and no separate cloud-software figure exists for those years. The full-year 2025 cloud-software figure of $25 million comes from the results presentation rather than the 10-K, which does not disclose it.
Herbalife has repurchased about $6.5 billion of its own stock since 2007. The last $2.0 billion of it, spent between 2020 and 2022, bought 42.5 million shares now worth $518 million, and roughly two-thirds of that money went to a single departing holder. The incentive plan that governs what management does with the next surplus pays on two measures — local-currency net sales and adjusted EBITDA — and on neither cash flow nor debt.
The record of the last surplus
The buyback programme is the reason the balance sheet looks the way it does. The FY2025 Form 10-K states plainly that the company's debt "has not resulted from the need to fund our normal operations, but instead has resulted primarily from our share repurchase programs," and puts cumulative repurchases since 2007 at approximately $6.5 billion [1].
The most recent tranche is the one a buyer today still owns. In August 2020 Herbalife completed a modified Dutch auction tender offer, repurchasing about 15.4 million shares at $48.75 for $750.0 million; open-market purchases took the 2020 total to 18.4 million shares for $892.1 million at an average of $48.53 [2]. In January 2021 the company bought approximately 12.5 million shares directly from Carl C. Icahn and his affiliates for approximately $600.0 million, or $48.05 a share; with open-market buying, 2021 totalled 20.4 million shares for $982.7 million. A further 3.7 million shares followed in 2022 at an average of $35.73, for $131.8 million [3].
Spent 2020-2022 ($M)
Shares Retired (M)
Worth at $12.18 ($M)
Share of Cost Recovered
Sources: repurchase volumes and prices per the FY2021 [4] and FY2022 [5] Forms 10-K; value today derived at the 27 July 2026 close of $12.18.
Forty-two and a half million shares for $2,006.6 million is an average of $47.21. At $12.18 the same shares would cost $517.7 million. The $1,489 million difference is larger than Herbalife's entire market value today, and it is the arithmetic behind the shareholders' deficit and the debt stack described in Business and Balance Sheet and Debt and Covenants.
Two-thirds of that money went to one seller. The $600.0 million January 2021 block is named to Icahn in the filing itself. The August 2020 tender is not attributed in the 10-K, but Icahn's Section 16 record reports the sale of 14,722,025 shares at $48.75 on 12 August 2020 — the tender price, and 96% of the shares the company bought in that offer. Taken together, approximately $1,318 million of the $2,007 million, or 66%, retired the position of a single activist holder rather than shrinking the share count against the open market.
A commitment that lapsed
In February 2022, with the balance sheet already carrying the 2020-2021 spending, the company built repurchases into guidance for the first time: "Our 2022 guidance includes the assumption of $50 million in share repurchase per quarter, which reflects the minimum buyback amount we anticipate completing on a quarterly basis" [6]. Asked whether that was a commitment, the finance chief said the intent was to give investors "a sign of commitment to our share repurchase program beyond the words that we have historically provided" [7].
The full-year outcome was $131.8 million — less than two of the four promised quarters [8]. In 2023 the company repurchased nothing [9], and the $1.5 billion authorisation expired in February 2024 with approximately $985.5 million unused [10]. The pattern is consistent rather than random: the company bought heavily at $48, tapered at $36, and stopped entirely below $10. That record sits alongside the restored $400 million restricted-payments basket the April 2026 amendment created [11].
What the board buys now
Capital allocation since 2025 has moved from the share count to acquisitions. Four transactions have closed in fifteen months, all small at the base and all carrying earn-outs that are several times the base.
Sources: Pruvit and Pro2col asset purchases, milestone payments and the $5m-$25m and $46m contingent ceilings per the FY2025 Form 10-K, Note 2 [12]; Link BioSciences per the same note [13]; Bioniq per the Q1 2026 Form 10-Q [14].
The Pruvit and Pro2col assets were bought together for $19 million on 17 April 2025, of which $14.4 million was allocated to Pro2col's software. Pruvit carries a milestone of $5 million to $25 million payable in the second quarter of 2027; Pro2col carries subscriber-milestone payments capped at $46 million in aggregate and running to 2035, of which $5 million was already triggered in 2025 [15]. Link BioSciences cost $6.5 million for a 51% interest in the acquiring vehicle [16]. Bioniq, closed on 30 April 2026, is $55 million of base consideration payable over five years plus up to $95 million of sales-milestone payments [17].
Base cash of about $85.5 million is genuinely small against $252.9 million of 2025 free cash flow, which is management's own framing: the finance chief told the February 2026 call the programme is "not a huge use of cash" and that the company is "still looking to do small acquisitions but still get our total debt down to $1.4 billion by the end of 2028" [18]. The $166 million of contingent ceilings is the part that is not small: if the milestones are hit, the pay-away lands in 2027 and beyond, inside the window in which roughly $700 million of debt must be retired to reach the $1.4 billion target set out in Debt and Covenants.
One transaction supplies an outside mark. In February 2026 Cristiano Ronaldo's holding entity took an initial 5% of HBL Pro2col Software in exchange for services and sponsorship rights, then exercised an option for a further 5% at $7.5 million, reaching 10% fully diluted, with options over another 10% expiring in January 2028 [19]. Taken literally, $7.5 million for 5% values the platform at $150 million, against $14.4 million of software assets recognised nine months earlier. The caveat is real: this is a fixed-price option granted alongside a sponsorship, not an arm's-length clearing price, and the first tranche was paid in services. It is a directional signal, not a valuation.
The two numbers management is paid on
For 2025 the Compensation Committee set the annual incentive on two equally weighted metrics: targeted local-currency net sales and adjusted EBITDA [20]. The performance stock units reintroduced in 2025 run on the same pair, again split half and half, measured over three years to December 2027 [21].
So the short-term plan and the long-term plan measure the same two things. Nothing in either references cash flow, leverage, debt reduction, return on capital, or share-price performance relative to a peer group. That matters here more than it would elsewhere: the finance chief has stated his own ranking — "My number one priority is still to get our gross debt down to $1.4 billion by 2028, which would get our net debt below $1 billion" [22] — and that priority appears in no incentive metric the proxy discloses. The stock appreciation rights, which are struck at the grant-date price and pay only on appreciation, are the sole element that moves with the share price, and they are a form rather than a metric.
What that omission cost is on the record. The company's own leverage reconciliation carries both ends of it [23]. Between 2021 and 2025 Herbalife generated $1,143.8 million of free cash flow and cut Credit Agreement total debt from $2,845.8 million to $2,050.0 million, and over the same four years its equity fell from $4,433 million to $1,335 million, because adjusted EBITDA dropped 24.7% and the enterprise multiple went from 7.6 times to 4.6 times. Of the four terms in that sentence, the incentive plan pays on one — adjusted EBITDA. The forward version of the same trade, and what is different about it now, is worked through in Valuation Arithmetic.
The local-currency construction also decides how the growth this report has been examining is credited. Net sales are measured with exchange-rate movement removed, and adjusted EBITDA is "further adjusted to include for bonus purposes, the impact of changes in currency exchange rates" [24]. Volume and price count identically, and India's post-GST surge — the subject of India Concentration — counts in full.
The bar, and where it was set
The 2025 adjusted EBITDA target was $620.0 million against $645.8 million achieved on the same basis in 2024 [25]. Actual came in at $634.9 million, 102.4% of target, which paid 124.0% on that half. Local-currency net sales of $4,920.2 million missed the $4,967.8 million target and paid 95.0%. The blended payout was 109.5% [26].
The slope is steep. Payout runs from 50% at 85% of the EBITDA target to a cap at 110% [27], which implies roughly ten points of payout for each 1% of EBITDA above plan. A 2.4% beat against a target set 4.0% below the prior year's result produced a 24-point premium on the larger half of the bonus.
The Committee addresses the target directly, and its answer is the strongest fact against reading the bar as low: the target "was below 2024 Adjusted EBITDA," but "reflected anticipated foreign currency headwinds," and "on a constant currency basis, the target would have been approximately $690 million, representing approximately 9% year-over-year growth" [28]. That is a coherent defence, and it is not verifiable from the outside, because the currency assumptions embedded in the plan are not disclosed and neither are the multi-year PSU targets, which the proxy says simply "correspond to the Company's long-range forecast" [29].
What can be checked is that the incentive plan runs on a fourth definition of EBITDA, alongside the three the loan documents and the earnings deck already use.
Sources: reported adjusted EBITDA per the June 2026 corporate overview, Historical Financial Summary [30]; the incentive-plan measure is the Company-Selected Measure in the proxy's pay-versus-performance table, presented as adjusted for bonus purposes [31] [32].
The gap is not always in management's favour: the bonus measure ran $29 million to $31 million above reported adjusted EBITDA in 2021, 2022 and 2023, $11 million above in 2024, and $22.7 million below in 2025. The gap runs in both directions across the five years. What it establishes is that the payout number differs from the number the market prices, and only the proxy discloses it. The multiple-denominator problem set out in Debt and Covenants extends into the pay plan.
Pay versus shareholder return
The pay-versus-performance table required by Item 402(v) puts the two series side by side.
Source: 2026 Proxy Statement, pay-versus-performance table [33]; the $100 investment is measured from 31 December 2020 and the peer index is the sixteen-company TSR group named in footnote 6, Pay v. Performance — p.71") [34]. 2022 and 2025 combine the two individuals who held the chief-executive role in those years.
Compensation actually paid to the two people who held the chief-executive role in 2025 was $27.2 million — $14.0 million to Michael Johnson as Executive Chairman and former CEO, $13.1 million to Stephan Gratziani — more than double any earlier year in the table [35]. Compensation actually paid marks unvested awards to year-end, and the shares roughly doubled during 2025 from a February low. The measure did what it is designed to do. The cumulative column is the one that does not move: $100 invested at the end of 2020 was worth $26.83 at the end of 2025, against $71.50 in the peer group.
Total summary-table compensation for the six named officers was $22.9 million in 2025, about 9% of the year's free cash flow, and the disclosed CEO pay ratio is 151:1 against a median employee at $50,032 [36] [37]. The benchmark set is larger than the company: the sixteen-name compensation peer group had median revenue of $6.0 billion and median market capitalisation of $4.1 billion, placing Herbalife at the 45th percentile on revenue and the 32nd on market value [38].
Shareholders registered that. Say-on-pay carried with approximately 51.5% of votes cast at the 2025 annual general meeting [39]. The Committee's stated response was that "a key theme we heard from shareholders was a desire for an increased emphasis on performance-based long-term incentives," and it reintroduced PSUs in 2025 after pausing them in 2023 and 2024 [40].
The next agreement moves the other way. An employment agreement with Michael Johnson dated 18 February 2026 runs from 1 May 2026 to 30 April 2027 at a salary of $700,000, with a target bonus of 100% of salary and long-term incentives of $5,600,000 [41]. Those awards are 25% restricted stock units and 75% stock appreciation rights, with no performance stock units, and all of them vest on the date of the 2027 annual general meeting — roughly twelve months. The agreement also carries a $500,000 annual personal-use jet allowance [42]. The defence is that three-quarters of the value is in SARs struck at market, which pay nothing unless the shares rise; the counterpoint is that the 2025 award to the same executive was half PSUs, and a year after telling shareholders it had heard them on performance-based long-term incentives, the board wrote a package containing none, in an instrument that vests in a year.
Ownership, and who has been buying
The register is concentrated in funds rather than insiders. At the 9 March 2026 record date, Vanguard held 12.08%, Nantahala Capital Management 8.40%, The Baupost Group 8.33%, Route One Investment Company 7.28%, BlackRock 7.16% and Renaissance Technologies 5.43%; all eleven directors and six named officers together held 5.12% [43]. Icahn, whose affiliated entities beneficially owned 23.85% of the outstanding shares as recently as the 2020 record date, is gone [44].
The Section 16 record since January 2021 shows 48 open-market purchases by insiders totalling $5.8 million, against $19.6 million of open-market sales excluding the Icahn transactions. Nineteen of those 48 purchases, worth $0.9 million, were made by one director, Juan Miguel Mendoza, who is also a top independent distributor. Since January 2024 only two purchases were made by executive officers: Johnson bought $498,300 at $8.07 in February 2024, and the Chief Legal Officer bought $25,800. Two officers sold in May 2026 after the refinancing and the share-price recovery — the Chief Commercial Officer $1.9 million and the Chief Operating Officer $0.6 million.
The proxy's related-party section carries three items worth a professional investor's attention. Gratziani was paid approximately $753,994 in 2025 "in consideration for suspending his distributorship operations." The sister and brother-in-law of director Juan Miguel Mendoza earned approximately $1,263,466 under the Marketing Plan. And the company reimbursed Johnson $475,457 for chartered air transportation from BLADE Urban Air Mobility, where his son-in-law serves as a senior executive and aircraft broker; the Audit Committee reviewed and approved it [45]. Two of the eleven directors are classified as non-independent specifically because they earn distributor income [46], which is a structural feature of this model rather than an anomaly — but it means the board that sets the Marketing Plan payout includes people paid by it.
What would move the read
The favourable reading is that the destructive capital allocation was executed by a different management team at a different price, that the board has since chosen the cheapest available use of cash — retiring debt — and that acquisitions have been kept to a scale the balance sheet can absorb. The record supports the first two claims; the third depends on earn-outs that have not yet come due.
Three things would change it. The first is the 2026 say-on-pay result and whether the Committee's next design reinstates performance conditions on the Executive Chairman's award. The second is a repurchase authorisation: the restricted-payments basket now permits roughly $400 million [47], and reinstating buybacks before the $1.4 billion gross-debt target is met would say which priority is real. The third is the contingent-payment schedule — Pruvit's milestone falls due in the second quarter of 2027 and Bioniq's payments run to 2031, so the 2026 and 2027 cash flow statements will show whether the acquisition programme stayed at $85 million or became a $250 million one.
At $12.18 the equity is worth $1.26 billion against $1.59 billion of net debt, so the market carries the enterprise at $2.86 billion — 4.3 times trailing adjusted EBITDA — and the shares are 44% of that. One turn of the multiple is $6.46 a share. The return available from here is mostly debt repayment moving across to the equity, and the four years to 2025 already ran that experiment.
Between 2021 and 2025 Herbalife generated $1,143.8 million of free cash flow and cut Credit Agreement total debt from $2,845.8 million to $2,050.0 million, and over the same four years its equity fell from $4,433 million to $1,335 million, because adjusted EBITDA dropped 24.7% and the enterprise multiple went from 7.6 times to 4.6 times. [1] [2]
The same experiment already ran, from 2021 to 2025
Cumulative free cash flow across those four years was $1,143.8 million — $308.9 million, $196.1 million, $222.5 million, $163.4 million and $252.9 million [3] [4] — and Credit Agreement total debt came down $795.8 million, from $2,845.8 million to $2,050.0 million [5]. Over the same period the equity went from $4,433 million to $1,335 million, a fall of $3,098 million, or 2.5 times Herbalife's entire market value today.
The other two terms are where it went. Adjusted EBITDA fell 24.7%, from $873.5 million to $657.6 million, and the enterprise multiple went from 7.6 times to 4.6 times [6]. Enterprise value fell $3.6 billion while debt came down $0.8 billion, and the difference landed entirely on the residual claim. That is the strongest fact against the deleveraging case, and it is the record of the period that produced today's balance sheet.
The forward version of the same trade is the smaller one. The stated target takes gross debt to $1.4 billion by 2028 and net debt from $1,593.4 million to below $1.0 billion [7]. That is $593 million: $5.72 a share flat across every cell of the sensitivity grid below, and $17.90 a share at an unchanged multiple. The transfer that already ran was the larger one on the debt side, $795.8 million retired, and it came alongside $3,098 million of equity value lost.
Two of the starting conditions have changed, and they are the two that did the damage. Adjusted EBITDA has risen for two consecutive years — $570.6 million in 2023, $634.8 million in 2024, $657.6 million in 2025, with 2026 guided to $675 million to $705 million [8] — rather than falling, and the multiple starts at 4.3 times against 7.6 times, so there is 44% less of it to lose.
The cash-flow half of the record carries its own qualification, and it runs against the bull case. Cash capital expenditure fell from $151.4 million in 2021 to $80.4 million in 2025 [9] [10], and between 2023 and 2025 free cash flow rose $30.4 million while operating cash flow fell $24.2 million. The improvement came from the capital line rather than from operations, and the company guides 2026 capital expenditure to $50 million to $80 million with a further $35 million to $55 million of capitalised software implementation cost on top of it [11] — $85 million to $135 million combined against $80.4 million spent in 2025. The capital line cannot make that contribution again.
The enterprise, and the slice of it that is equity
Herbalife had 103,669,416 common shares outstanding on 29 April 2026 [12]. At the 27 July 2026 close of $12.18 that is $1,262.7 million of market value. Against it sit $2,044.6 million of Credit Agreement total debt and $451.2 million of cash at 31 March 2026, which the company nets to $1,593.4 million [13]. Enterprise value is therefore about $2,856 million.
Share Price
Market Value ($M)
Net Debt ($M)
Enterprise Value ($M)
EV / Adj. EBITDA
Sources: share count of 103,669,416 per the Q1 2026 Form 10-Q cover [14]; debt, cash and trailing adjusted EBITDA of $668.4 million per the May 2026 earnings presentation [15]; closing price 27 July 2026 as reported.
The choice of denominator changes the answer by nearly a turn. Trailing twelve months to March 2026, Herbalife reports unadjusted EBITDA of $617.7 million, adjusted EBITDA of $668.4 million and Credit Agreement EBITDA of $744.0 million [16]. The same enterprise value is 4.6 times, 4.3 times and 3.8 times those three figures. The comparisons below use the unadjusted measure against peers, because that is what the peer data supports, and the adjusted measure where Herbalife's own guidance is the reference.
Equity is 44.2% of enterprise value, so the enterprise is levered 2.26 times into the shares: a 10% move in enterprise value is a 23% move in the equity. That is the leverage described in Business and Balance Sheet, stated as a coefficient.
The multiple, in its own history
Source: derived from year-end closing prices and share counts as reported, with Credit Agreement total debt and cash per the June 2026 corporate overview [17] and the May 2026 earnings presentation [18].
Sources: adjusted EBITDA 2021–2025 and Credit Agreement total debt per the June 2026 corporate overview [19]; trailing adjusted EBITDA of $668.4 million and net debt of $1,593.4 million per the May 2026 earnings presentation [20]; enterprise value derived from reported prices and share counts.
Adjusted EBITDA fell from $873.5 million in 2021 to $570.6 million in 2023 and recovered to $657.6 million in 2025 [21]. The multiple on it fell further and has not recovered: 7.6 times at the end of 2021, 4.3 times today. The equity's share of enterprise value went to 26% at the end of 2024, when the shares closed the year at $6.69, and is back to 44% now.
The peer set has been repriced with it
Source: derived from each company's reported financial statements (operating income plus depreciation and amortisation for the last completed fiscal year, with the most recent quarterly balance sheet) and closing prices on 27 July 2026; Herbalife's EBITDA of $602.7 million for 2025 per the June 2026 corporate overview [22]. Fiscal year-ends differ, as shown.
The peer set is the one Herbalife names in its own Item 1 and that Channel or Category used to separate a product problem from a distribution problem. On the growth evidence that chapter assembled, the retail branded-protein names were the winners: BellRing grew net sales 16% to $2,316.6 million in the year to September 2025 [23], and Simply Good Foods grew 9.0% to $1,450.9 million in the year to August 2025 [24].
The market has not paid for that growth. Since 31 December 2024 BellRing has fallen 83% and Simply Good Foods 73%, while Herbalife has risen 82%. Both retail names now trade near seven times their last reported full-year EBITDA, and both have since reported lower operating profit than the prior-year period. Herbalife at 4.7 times sits between them and the two lowest-rated direct sellers — Nu Skin at 2.4 times on revenue down 14.3%, and USANA at 3.6 times on revenue up 8.3%. Medifast's enterprise value is negative: its $109 million of market value is below the $169 million of cash on its balance sheet.
The useful conclusion is narrower than "Herbalife is cheap against faster-growing peers". The whole complex has been marked down, and against it Herbalife sits 2.4 turns below BellRing and 2.4 turns above Nu Skin. What the multiple is not doing is discriminating on growth: Nature's Sunshine, growing 5.7%, carries the highest multiple in the table at 7.3 times, and it is a $282 million enterprise.
What debt repayment is worth to the shares
The company's stated capital priority is explicit. Asked on the May 2026 call whether the completed refinancing changed anything, the CFO said the number one priority remained reducing gross debt to $1.4 billion by 2028, "which would get our net debt below $1 billion" [25]. That is a $593 million reduction from the $1,593.4 million reported at March 2026 [26], spread over the eleven quarters to the end of 2028 — about $54 million a quarter.
Herbalife generated $333.3 million of operating cash flow against $80.4 million of capital expenditure in 2025, or $252.9 million of free cash flow, and paid $205.7 million of cash interest [27]. That is $63 million a quarter — enough for the target, with nothing left over. The April refinancing adds roughly $45 million of annualised cash interest saving, against a $20 million to $25 million full-year headwind from the India goods-and-services-tax mismatch [28].
Two pieces of arithmetic follow. First, $252.9 million of 2025 free cash flow against $1,262.7 million of market value is a 20.0% free-cash-flow yield; on a normalised figure of roughly $275 million after the interest saving and the India cost, 21.8%. Second, if the enterprise value stays where it is and net debt falls to $1.0 billion, the residual left to the equity is $1,856 million, or $17.90 a share — 47% above today's price, without any change in the multiple and without growth. The consensus target price of $18.33 is essentially that same calculation, drawn from a coverage list of two to three contributing analysts.
Sources: adjusted EBITDA per the June 2026 corporate overview [29]; free cash flow derived as operating cash flow less purchases of property, plant and equipment per the FY2025 Form 10-K statements of cash flows [30] and the equivalent prior-year statements.
Conversion of adjusted EBITDA into free cash flow has run between 25.7% and 39.0% over five years and averaged 33.4%, with no trend. Cash interest is most of the gap: $205.7 million in 2025 was 31% of adjusted EBITDA [31]. A 20% free-cash-flow yield on this equity is the arithmetic consequence of a business converting a third of its EBITDA to cash while carrying 56% of its enterprise value in debt.
Sensitivity
Source: derived from reported figures — equity value per share equals the multiple times adjusted EBITDA less $1,593.4 million of net debt [32], divided by 103,669,416 shares [33]. Columns are adjusted EBITDA levels: $570M is the 2023 trough, $670M approximates the trailing figure, $720M is above the top of 2026 guidance.
The grid holds net debt at today's $1,593.4 million. Reaching the stated end-2028 target of $1.0 billion adds a flat $5.72 to every cell — the $593 million of repayment divided by the share count.
Two readings come out of it. The case is most sensitive to the multiple: one turn on trailing adjusted EBITDA is $6.46 a share, 53% of the current price, while a $50 million move in adjusted EBITDA at today's multiple is $2.06 a share, 17%. And on the midpoint of 2026 guidance, $690 million, today's price implies 4.1 times, against 4.3 times on the trailing figure.
What sits outside the enterprise value
Four items do not appear in the $2,856 million.
Roughly $260 million of tax assessments in Brazil, India and Mexico are carried with nothing accrued against them, about a fifth of market value, as set out in Consent Order and Claims. Herbalife had $150.8 million of issued but undrawn letters of credit and similar arrangements outstanding at 31 March 2026, of which roughly $110 million is the letter of credit and surety bonds posted against the Brazil assessments [34].
Share-based compensation was $44.1 million in 2025 [35], equal to 3.5% of market value and 17% of free cash flow, and it is added back in reaching Credit Agreement EBITDA [36]. With no open-market repurchases in 2023 through the first quarter of 2026 (Debt and Covenants), shares outstanding have risen from 100.2 million at the end of 2023 to 103,669,416 at 29 April 2026 [37].
The $277.5 million of convertible notes due June 2028 carry a conversion price of about $16.98 and are already inside the debt figure; principal is settled in cash and only value above the conversion price can be settled in shares [38]. Their effect is already visible in the share count: first-quarter 2026 diluted shares of 108.4 million against 103.8 million basic, with diluted earnings per share of $0.57 [39].
Finally, the earnings multiple most quotable from a screen is an adjusted one. Consensus of about $2.56 for 2026 puts the shares near 4.8 times forward earnings, but the company expects a full-year 2026 adjusted effective tax rate of approximately 30% [40] against the 17.2% realised in 2025, and reported 2026 earnings will also absorb a preliminary charge of approximately $95 million for the loss on extinguishment of the refinanced debt [41]. On enterprise value and cash flow the picture is steadier than the earnings line will look this year.
What would change the read
The evidence supports a specific read rather than a directional one: at $12.18 the equity is priced at roughly 4.6 times enterprise EBITDA and a 20% free-cash-flow yield, and almost all of the identifiable return from here is the transfer of about $593 million of net debt repayment across to the residual claim — $17.90 a share at an unchanged multiple. The strongest fact against it is that the identical transfer ran from 2021 to 2025 and the equity still lost 70%, because EBITDA and the multiple moved further than the debt did.
The report closes on three things that would move the read, each checkable in a filing:
Adjusted EBITDA holding the guided $675 million to $705 million range through the September 2026 anniversary of the India tax cut, which India Concentration shows is where the recent growth sits. Landing at the low end rather than the top of that range is about $1.25 a share at today's multiple, before any change in the multiple itself.
Net debt falling at the roughly $54 million a quarter the 2028 target requires, reported each quarter in the leverage reconciliation that Debt and Covenants works through. Free cash flow of $252.9 million in 2025 covers that and no more, so an acquisition of any size, or a working-capital reversal, competes directly with the target — as does the restored restricted-payments capacity set out in Pay and Capital Allocation.
And the multiple. At 3.0 times — between where Nu Skin and USANA trade — the equity is worth $2.57 to $4.02 a share on the same EBITDA. At 6.0 times, near where the retail names still sit, it is $20 to $23. That range is not a forecast; it is the width of the residual claim once the debt is fixed and only the multiple moves.